- Research article
- Open access
- Published:
Plastome phylogenomic study of Gentianeae (Gentianaceae): widespread gene tree discordance and its association with evolutionary rate heterogeneity of plastid genes
BMC Plant Biology volume 20, Article number: 340 (2020)
Abstract
Background
Plastome-scale data have been prevalent in reconstructing the plant Tree of Life. However, phylogenomic studies currently based on plastomes rely primarily on maximum likelihood inference of concatenated alignments of plastid genes, and thus phylogenetic discordance produced by individual plastid genes has generally been ignored. Moreover, structural and functional characteristics of plastomes indicate that plastid genes may not evolve as a single locus and are experiencing different evolutionary forces, yet the genetic characteristics of plastid genes within a lineage remain poorly studied.
Results
We sequenced and annotated 10 plastome sequences of Gentianeae. Phylogenomic analyses yielded robust relationships among genera within Gentianeae. We detected great variation of gene tree topologies and revealed that more than half of the genes, including one (atpB) of the three widely used plastid markers (rbcL, atpB and matK) in phylogenetic inference of Gentianeae, are likely contributing to phylogenetic ambiguity of Gentianeae. Estimation of nucleotide substitution rates showed extensive rate heterogeneity among different plastid genes and among different functional groups of genes. Comparative analysis suggested that the ribosomal protein (RPL and RPS) genes and the RNA polymerase (RPO) genes have higher substitution rates and genetic variations among plastid genes in Gentianeae. Our study revealed that just one (matK) of the three (matK, ndhB and rbcL) widely used markers show high phylogenetic informativeness (PI) value. Due to the high PI and lowest gene-tree discordance, rpoC2 is advocated as a promising plastid DNA barcode for taxonomic studies of Gentianeae. Furthermore, our analyses revealed a positive correlation of evolutionary rates with genetic variation of plastid genes, but a negative correlation with gene-tree discordance under purifying selection.
Conclusions
Overall, our results demonstrate the heterogeneity of nucleotide substitution rates and genetic characteristics among plastid genes providing new insights into plastome evolution, while highlighting the necessity of considering gene-tree discordance into phylogenomic studies based on plastome-scale data.
Background
Whole plastomes have become more accessible with the explosive development of next-generation sequencing (NGS) technologies [1,2,3]. Due to the unique mode of inheritance, conservativeness in gene content and order, and high copy number per cell [4, 5], plastomes have been widely used in reconstructing the plant Tree of Life (e.g. [6,7,8,9,10]). Moreover, compared to standard fragment DNA barcodes, plastome-scale data can provide an abundance of informative sites for phylogenetic analyses [5, 11,12,13]. Nonetheless, the effectiveness of plastome-scale data is ultimately reflected by the extent to which they reveal the “true” phylogenetic relationships of a given lineage [14].
Although plastomes have been canonically regarded as a linked single locus due to its uniparental inheritance and lack of sexual recombination [4, 5, 15], empirical studies on the structural and functional characteristics of plastomes indicate that plastid genes may not evolve as a single locus and might experience divergent evolutionary forces [16,17,18]. In addition, despite evolving at lower rates than the nucleus [19], rates of nucleotide substitution in the plastome have been found to vary across angiosperm lineages, as well between inverted repeat and single copy regions and among different functional gene groups (e.g. [16, 20,21,22]). Factors contributing to rate variation and affecting the evolution of different plastid genes include mutation rate variation across families and between coding/non-coding regions, as well as variation in the single copy regions due to the presence of two configurations of the inversion [14]. However, in many recent phylogenomic studies using the full plastomes, only the results from the full concatenated data set are presented (e.g. [6, 7, 23]). In these cases, gene-tree discordance due to evolutionary rate variation of individual genes remains poorly understood. In addition to concatenated approaches, multispecies coalescent (MSC) methods account for gene tree heterogeneity allowing for the assessment of ancient hybridization, introgression, and incomplete lineage sorting (ILS) by using the summed fits of gene trees to estimate the species tree [24, 25]. Recently, phylogenomic studies suggest that a combination of concatenated and coalescent methods can produce accurate phylogenies and benefit the investigation into the incongruence between gene trees and species trees [18, 26].
Comparative genomic studies based on plastomes have mainly concentrated on structure variations, such as contraction or expansion of inverted repeats (IR) (e.g. [27,28,29]) and genomic rearrangements (e.g. [30,31,32,33]), yet the genetic characteristics of plastid genes within a lineage, such as genetic variation and phylogenetic informativeness, remain poorly studied. These characteristics may vary among different genes or functional groups of genes and are of great importance in our understanding of plastome evolution and phylogenetic inference. Additionally, the correlation between evolutionary rate and gene characteristics can be invoked as an explanation of the primary impetus of plastome evolution [16, 20, 34, 35].
The tribe Gentianeae, with its two subtribes Gentianinae and Swertiinae, includes ca. 950 species in 21 genera, exhibiting the highest species diversity of the Gentianaceae [36]. Members of Gentianinae are easily distinguishable from Swertiinae by the presence of intracalycine membranes between the corolla lobes and plicae between the corolla lobes, with both traits absent in Swertiinae [36,37,38]. Although several phylogenetic studies have confirmed the monophyly of both subtribes [36,37,38,39,40], the generic delimitation within Gentianeae remains ambiguous, especially within Swertiinae, with some genera (e.g., Swertia L., Gentianella Moench, Comastoma (Wettst.) Toyok., Lomatogonium A.Braun) being paraphyletic [38]. The current phylogeny of Gentianeae is based upon a few DNA markers, commonly including ITS, atpB, rbcL, matK, and trnL–trnF [36,37,38,39,40,41], thus a full taxonomic and evolutionary understanding of these groups is hindered by the unsatisfactory phylogenetic resolution.
To gain new insights into the evolution of plastomes, and to improve delineation of the phylogenetic affinities among genera in Gentianeae, we constructed a dataset of plastome sequences including 29 Gentianeae species and three outgroups. We generated 76 protein-coding gene (PCG) sequences to infer phylogenies via both concatenated and coalescent methods, and characterised genetic features of plastid genes. Our specific goals are to (a) test whether plastome-scale data is effective in resolving enigmatic relationships within Gentianeae; (b) investigate characteristic diversity of plastid genes of Gentianeae; and (c) explore the correlation of evolutionary rate heterogeneity with gene characteristics as well as gene-tree discordance.
Results
Characteristics of Gentianeae plastomes
A total of 10 species were newly sequenced (Additional file 1: Table S1) representing 10 genera (seven newly reported) of Gentianeae. After de novo assembly, we generated a single contig for each newly sequenced plastome. The mean sequencing coverage ranged from 646× (Gentiana urnula) to 3538× (Gentianopsis paludosa). All 10 plastomes display the typical quadripartite structure composed of a large single copy (LSC), a small single copy (SSC), and two inverted repeats (IRa and IRb). The length of the 10 plastomes range from 139,976 bp in Kuepferia otophora to 153,305 bp in Halenia elliptica (Table 1). All the plastomes have four rRNAs and 30 tRNAs and are in the same gene order (Fig. 1). Gene loss involving ndh genes in the genus Gentiana was detected. Moreover, the rpl33 gene was found to be lost in Comastoma pulmonarium and Swertia hispidicalyx (Figs. 1, 2 and Additional file 1: Fig. S1). Plastomes of Gentianeae were highly conserved with only one event of IR expansion occurring in Halenia elliptica, where IR regions expanded to the rpl22 gene.

Linear maps of 10 newly sequenced plastomes of Gentianeae. Full-color boxes with labeled gene names highlight coding sequences by gene class, as summarized to the bottom-left corner

Phylogenetic result of Gentianeae, with a distribution of gene loss mapped on the cladogram generated by coalescent method in ASTRAL-III. Local posterior probabilities (PP) of all branches were 1.0, and were not showed in the tree. b Maximum likelihood phylogram of Gentianeae from partitioned concatenated matrix of 76 plastid protein-encoding genes using RAxML. Maximum likelihood bootstrap (BS) values and the PP calculated from MrBayes are shown at nodes, except nodes with 100% BS and 1.0 PP, ‘-’ indicates no support value
Phylogenetic relationships within Gentianeae
The concatenated alignment of the 76-gene, 32-taxa dataset had 69,579 bp in length consisting of 9228 parsimony-informative sites. Our phylogenomic analyses improved the resolution and robustness of affinities among genera in Gentianeae, with most clades exhibiting high support values. For concatenated data set, partitioned Maximum likelihood (ML) and Bayesian Inference (BI) analyses (Fig. 2) yielded identical tree topologies with unpartitioned data sets (Additional file 1: Fig. S2). The same tree topology was also inferred with the coalescent analysis (Fig. 2). The monophyly of two subtribes, i.e. Gentianinae and Swertiinae, were supported in all analyses. In Gentianinae, a clade consisting of Tripterospermum and Kuepferia was sister to Gentiana. Within Gentiana, species exhibiting ndh gene loss events formed a distinct clade and were sister to other members of Gentiana. In Swertiinae, Swertia was revealed as nonmonophyletic due to the close relationship between Swertia bimaculate with the monophyletic genus Halenia.
Gene trees landscape
We employed Principal Coordinate Analysis (PCoA) to investigate gene tree discordance using gene trees inferred from ML and species trees estimated from concatenated and coalescent analyses [42]. The results revealed that species trees inferred from two different methods were highly congruent, whereas individual gene trees exhibited greater variation. The first and second axes of the PCoA explained 13.8 and 4.7% of the variation in tree topologies, respectively. We calculated the distance between gene trees and the coalescent species tree to represent gene-tree discordance (GD) of each gene (Mean: 14.789; median: 14.560). Among 75 genes tested, rpoC2 had the lowest GD value (GD = 0) and petL had the highest (GD = 35.626). Gene trees from the three traditionally used plastid genes (rbcL, atpB and matK; GD = 2.213, 2.029 and 0.928) were close to the species trees (Fig. 3a, Additional file 1: Table S2).

Discordance of plastid gene trees. a Principal coordinate analysis depicting ordinations of two species trees (green and pink) versus 75 plastid protein-coding gene (PCG) trees (blue) using unrooted Robinson-Foulds algorithms. Since TREESPACE only accepts groups of trees containing the same tips, rpl33 locus was removed. Genes widely used in phylogenetic studies of Gentianeae are indicated in the plots (matK, rbcL, and atpB). b Partitioned coalescence support (PCS) of each PCG. Names of 76 PCGs are labeled in red color
We also computed the partitioned coalescence supports (PCSs) of the 76 PCGs. PCS can be positive, negative, or zero, indicating support, conflict, or ambiguity, respectively [43]. The results revealed 33 PCGs with positive PCS scores, 23 PCGs with negative PCS scores and 20 PCGs with zero PCS scores (Fig. 3b, Additional file 1: Table S2). Six PCGs (ccsA, psbH, rbcL, rpoC2, rps11 and rps19) were estimated with highest PCS score (PCS = 56). Among the three widely used plastid markers in previous phylogenetic studies of Gentianeae, rbcL and matK had positive PCS scores, whereas atpB had a negative PCS score.
Nucleotide substitution rates
Synonymous (dS) and nonsynonymous (dN) substitution rates, along with dN/dS were estimated for the 76 PCGs to detect evolutionary rate heterogeneity and to represent different selection regimes acting on PCGs (Table S2). Among the 76 genes, rps22, rps15 and rpl32 had relatively higher dS values, and ycf1, matK and rpl33 had higher dN values (Fig. 4a, Additional file 1: Table S2). All 76 PCGs exhibited considerably low values of dN/dS, indicating that they have been under purifying selection. We also compared evolutionary rates among nine functional groups and one group of other genes (OG, Table 2). The OG had the highest median values of dN and dN/dS but a moderate dS median value. Genes that encode subunits involved in photosynthetic processes, such as photosystems I and II (PSA and PSB), ATP synthase (ATP) and cytochrome b6f complex (PET), had lower rates of nucleotide substitution than other functional groups. The RNA polymerase (RPO) genes showed highly increased dN and dN/dS values, while genes encoding proteins of the ribosomal large subunit (RPL) had the highest dS value (Fig. 4b). We also concatenated the genes located in the LSC, SSC and IR to investigate substitution rate differences among IR vs SC regions. The IR region had the lowest dN and dS values (0.095 and 0.200 respectively), and the SSC region had the highest (dN = 0.464; dS = 0.958), followed by the LSC region (dN = 0.134; dS = 0.878).

The estimations of nonsynonymous (dN), synonymous (dS) substitution rates and dN/dS of a plastid protein-coding genes (PCG), and of b functional groups of genes. Detailed information of functional group is provided in Table 2
Genetic characteristics of plastid genes
We calculated the nucleotide diversity (π) and percent variability (PV) to represent genetic variation of PCGs (Additional file 1: Table S2). The values of π ranged from 0.0077 (rps7) to 0.0884 (ycf1), and values of PV ranged from 0.0271 (ndhF) to 0.3872 (rpoC1, Fig. 5a, Table S2). Among the functional groups, RPO, RPS, RPL and NDH showed both high nucleotide diversity and percent variability (Figs. 5b and c), especially genes in the RPO group. In addition, RPO had the highest median value of gene length (Fig. 5d). The net phylogenetic informativeness (PI) for the 76 PCGs used in phylogenetic analysis were measured using PhyDesign (Additional file 1: Fig. S3 and Table S2). The ycf1 gene had the highest net PI value, followed by rpoC2, ndhF and matK. Genes with longer length generally showed high PI values (Additional file 1: Table S2), indicating gene length contributes large to phylogenetic informativeness.

Genetic variation among plastid protein-coding genes (PCGs) and among functional groups. a Nucleotide diversity (π) and percent variability (PV) of 76 PCGs. b Nucleotide diversity (π), c percent variability (PV) and d gene length of functional groups
Correlation analysis
Correlation analysis showed all tested correlations were significant with a 0.05 cutoff (Fig. 6). Specifically, nucleotide diversity (π) (Fig. 6d, e and f), percent variability (PV) (Fig. 6g, h and i) and phylogenetic informativeness (PI) (Fig. 6j, k and l) were all positively correlated with the rates of nucleotide substitution, whereas gene-tree discordance (GD) (Fig. 6a, b and c) was negatively correlated with the rates of nucleotide substitution.
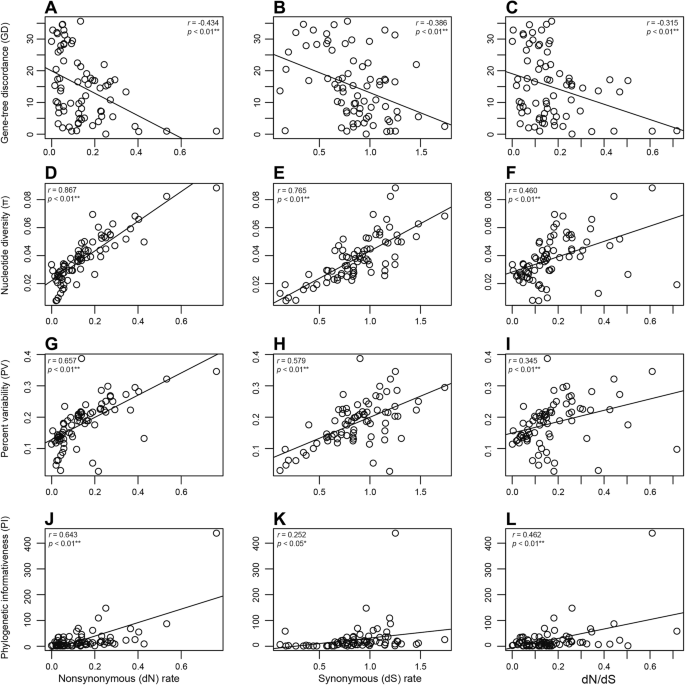
Correlation of evolutionary rate heterogeneity, including nonsynonymous (dN), synonymous (dS) substitution rates and dN/dS, with a-c gene tree discordance, d-f Nucleotide diversity (π), g-i percent variability (PV) and j-l phylogenetic informativeness. The stars next to the p-value were used to assess the level of significance
Discussion
Phylogenetic implications of plastome-scale dataset
To our knowledge, the results presented here are the first to utilize a phylogenomic data set to investigate phylogenetic affinities among genera of Gentianeae, especially for the subtribe Swertiinae. Our study presents substantial improvements in tree resolution compared to previous phylogenetic reconstructions [36,37,38,39,40, 44], and provide a robust backbone of Gentianeae. Our phylogenomic backbone shows a clear subdivision of the Gentianeae into subtribes Gentianinae and Swertiinae, which is consistent with previous morphological [45] and molecular phylogenies [36,37,38,39,40,41, 44]. Gentianinae is consistently recognized as encompassing four genera --Gentiana L., Tripterospermum Blume, Metagentiana T.N.Ho & S.W.Liu, and Crawfurdia Wall. Favre et al. [41] excluded Gentiana sect. Otophora from Gentiana and elevated as Kuepferia Adr.Favre and described Sinogentiana Adr. Favre & Y.M. Yuan by excluding two species from Metagentiana. Our results resolve Gentiana as monophyletic, and show a close relationship between Kuepferia and Tripterospermum, supporting the elevation of Kuepferia. Compared to Gentianinae, Swertiinae is more complicated due to the paraphyly of Swertia [38]. Our phylogenomic framework is congruent with the phylogeny of Swertiinae inferred using trnL-intron + matK [36, 37, 44], atpB-rbcL spacer [38], the supermatrix of eight plastid markers (rbcL+ matK+ atpB+ ndhF+ rpl16+ rps16+ trnL-trnF + atpB-rbcL) [40] and ITS [36,37,38, 44]. Overall, the present study places Gentianeae into a phylogenomic framework constituting the first steps in deeply understanding its evolutionary history. Further studies focusing on biogeography and diversification with denser sampling and more advanced methods are needed.
The majority of phylogenetic relationships of major groups of angiosperms that have been investigated in the last few decades rely mostly on ML inference of concatenated alignments of plastid genes (e.g. [7, 9, 10]). However, phylogenetic discordance produced by individual plastid genes has generally been largely ignored due to the fundamental assumption of a tightly linked unit of the plastome in coalescent theory. Goncalves et al. [18] showed that concatenated matrices may produce highly supported phylogenies that are discordant with individual gene trees. Walker et al. [14] demonstrated rampant gene-tree conflict within the plastome at all levels of angiosperm phylogeny, highlighting the necessity of future research into the consideration of plastome conflict. Both studies emphasized the importance of considering variation in phylogenetic signal across plastid genes and advocated the use of multispecies coalescent (MSC) methods with plastome matrices in phylogenomic investigations. In our analyses, despite the consistency between the tree topology produced by a concatenated matrix with that using MSC methods, gene tree topologies showed great variation with the species trees inferred from the concatenated data. Moreover, our computation of PCS revealed 23 of 76 plastid genes with negative scores and 20 genes with ambiguous estimation, indicating more than half of the genes are contributing to phylogenetic ambiguity of Gentianeae. A possible explanation for consistent topologies produced by the two methods is that the individual gene genealogy effect was too small to blur the accuracy of phylogenetic inference when all the genes were concatenated into a “supermatrix”. Methodologically, the individual gene trees and their bootstrap replicates that were used as inputs of MSC method in ASTRAL-III were inferred using ML in RAxML [46]. In such cases, conducting phylogenetic inference with concatenated genes as a single locus would represent a special case of MSC [25]. Nonetheless, such kind of gene-tree heterogeneity should not be disregarded, as it may influence divergence time estimation or higher taxonomic level phylogenetic reconstruction.
Our estimation of PCS scores revealed that one (atpB) of the three widely used plastid markers (rbcL, atpB and matK) in phylogenetic inference of Gentianeae was an outlier gene that may have a disproportionate influence on the resolution of contentious relationships [43]. However, phylogenetic analysis of Gentianeae using a plastid supermatrix including the atpB gene [40] obtained a generally congruent tree topology with topologies from other markers [36,37,38]. A possible explanation for the observed consistency is that a concatenated matrix of atpB with other plastid genes may counteract the potential bias of atpB in the reconstruction of Gentianeae relationships. In addition, the relatively low PCS score of matK (PCS = 4) is a likely reason for extensive parallel clades existing in the study by Xi et al. [44].
Gene characteristic diversity in plastomes of Gentianeae
Plastomes of Gentianeae are highly conserved in terms of genome structure with only one trivial IR expansion detected (Figs. 1 and 2). Gene loss events involving ndh genes and rpl33 in some species were detected. Loss of ndh genes in plastomes of Gentiana were previously reported in studies of Fu et al. [47] and Sun et al. [48]. In green plants, ndh genes encode components of the thylakoid ndh-complex involved in photosynthetic electron transport [49]. Recently, a comprehensive survey of gene loss and evolution of the plastomes showed ndh genes were the most commonly lost genes, suggesting that not all ndh genes are involved in or essential for functional electron transport [50]. Notably, the loss of ndh genes occurred within the genus Gentiana and formed a distinct clade, suggesting this loss may be related to adaptation of specific Gentiana species. Given that few plastomes of Gentiana are available compared to the total number of species (c. 360–400 species), further exploration with plastome sequencing is still required. In contrast to ndh genes, the loss of rpl33 is likely more random. There is a stop codon in the coding region of rpl33 in Comastoma pulmonarium due to the change of cytosine (C) to thymine (T) at base pair 22. We mapped all the sequenced reads of C. pulmonarium to the assembled sequence using Geneious for validation. Mapped reads showed that almost all the reads supported the mutation. In the plastome of Swertia hispidicalyx, there is a small deletion containing the coding region of rpl33 between the psaJ and rps18 gene. A previous study suggested that the loss of rpl22, rpl32, and rpl33 genes was more prominent than the loss of other rpl genes [50]. In addition, a reverse genetics study found that knockout of the gene encoding ribosomal protein rpl33 did not affect plant viability and growth under standard conditions [51]. Hence, rpl33 may be a nonessential plastid ribosomal protein in plant photosynthesis, and loss of rpl33 gene may be compensated for by other rpl genes or by nuclear encoded genes.
Estimating nucleotide substitution rates among different genes and different functional groups provided insight into the diverse selection regimes acting on plastomes evolution (e.g. [16, 20, 22]). In Poaceae [34] and Geraniaceae [17], it has been reported that genes encoding subunits involved in photosynthetic processes, such as NAD(P)H dehydrogenase (NDH), ATP synthase (ATP), photosystems I and II (PSA and PSB), and cytochrome b6f complex (PET), exhibit relatively lower nucleotide substitution rates than other functional groups of genes. Similar patterns were observed in Gentianeae (Fig. 4b). Among the photosynthetic functional groups, NDH had relatively higher nucleotide substitution rates, which was likely associated with the gene loss events in Gentiana. We identified a few functional gene groups that have accelerated substitution rates in Gentianeae, mainly the ribosomal protein (RPL and RPS) genes and the RNA polymerase (RPO) genes. Similar patterns have been previously documented, such as RPL and RPS genes were shown to be highly accelerated in Geraniaceae [20, 28] and RPO genes in Annonaceae, Passifloraceae and Geraniaceae [52]. In addition, accD, clpP, ycf1, and ycf2 had the most accelerated rates [22] as detected in plastomes of Silene (Caryophyllaceae), and clpP and ycf1 were found to have the highest dN values among genes in legumes [16]. In the present study, ycf1 and matK had the highest dN value, and ycf2 had the highest dN/dS value. Despite divergence of nucleotide substitution rates among individual genes or among functional groups of genes, there was no sign of positive selection acting on plastid genes of Gentianeae plastomes. Additionally, given that no obvious structure variation was detected, the pattern of substitution rate variation in Gentianeae may be attributed to the heterogeneity of genome-wide mutation rate. Furthermore, varied substitution rates in plastomes along with gene-tree discordance support the view that plastid genes are not tightly linked as previously thought and are experiencing different evolutionary forces [18].
Evolutionary dynamics of the plastid IR region has been previously documented [19]. A recent study demonstrated that synonymous substitution rates were, on average, 3.7 times slower in IR genes than in SC genes using 69 plastomes across 52 families of angiosperms, gymnosperms, and ferns [27]. However, a study of Pelargonium (Geraniaceae) observed the opposite pattern in which dS values were higher for genes in the IR versus the SC regions [29]. Our results reveal dS rates about four to five times higher in LSC and SSC regions than IR region using a concatenated data set of genes in each region. The observed high dS value in the SSC region likely results from the six NDH genes involved in gene loss. In turn, high synonymous substitution rates may indicate relaxed selective constrains are responsible for the gene loss events. The low substitution rates in the IR region can be explained by the two identical copies providing a template for error correction when a mutation occurs in one of the copies [29].
Correlation of evolutionary rate heterogeneity with gene characteristics and GD
Characteristics of plastid genes are of great importance in our understanding of plastome evolution and phylogenetic inference. We demonstrated extensive difference among plastid genes and functional groups of genes. The percent variability (PV) of PCGs exhibited similar pattern with nucleotide substitution rates of photosynthetic functional groups (ATP, NDH, PET, PSA and PSB) having lower values than ribosomal protein (RPL and RPS) and the RNA polymerase (RPO) groups, whereas the NDH group had higher values of nucleotide diversity (π). The value of π was estimated by the average number of nucleotide differences per site between two sequences and its sampling variance [53], and hence its estimation may be affected by the loss of ndh genes in Gentiana. Our results revealed a significant positive correlation of genetic variation with nucleotide substitution rates, indicating that diverse selection pressure is playing important roles in plastome evolution.
The net phylogenetic informativeness (PI) of a plastid gene reflects its performance in resolving complex phylogenetic relationships. Just one (matK) of the three (matK, ndhB and rbcL) markers widely used in phylogenetic studies of Gentianeae showed high net PI value, explaining the limited resolution in previous analyses and highlighting the utility of plastome-scale data sets. Among the genes tested, ycf1 and rpoC2 exhibited high net PI values, and accompanied by their relatively long gene length, would be optimal markers for phylogenetic inference of Gentianeae in the future. Indeed, the phylogenetic utility of ycf1 has been demonstrated previously in orchids [54] as well as in a radiating lineage [55], along with serving as a core barcode of land plants [56]. Our analyses revealed good performance of rpoC2, with high PI, lowest gene-tree discordance and positive high PCS score. Thus, we advocate rpoC2 as a promising plastid DNA barcode for taxonomic study of Gentianeae, similar to the usefulness of rpoC2 in the phylogenetic reconstruction of the angiosperm phylogeny [14].
We found a significant positive correlation of PI with nucleotide substitution rates, suggesting nucleotide substitutions of plastid genes are only slightly saturated. A sequence is considered saturated when it has undergone multiple substitutions that decreases phylogenetic information contained in the sequence due to underestimation of real genetic distance using the apparent distance [57]. Our analysis revealed negative correlation between gene-tree discordance (GD) and nucleotide substitution rates. Previous studies have drawn attention to the correlation between nucleotide substitution rates with number of indels and genomic rearrangements, such as in Geraniaceae [30], legumes [16, 21] and Lentibulariaceae [58], while GD remained poorly examined. In general, changes in dS are likely to be impacted by potential factors contributing to the variation of mutation rate, such as DNA repair. However, changes in dN and dN/dS are mostly driven not only by the varied mutation rate, but also by selective constraint. Given no sign of positive selection among plastid genes of Gentianeae, the correlation between GD with dN and dN/dS suggested GD is possibly governed by the strength of purifying selection or the selective removal of deleterious mutations. The negative correlation between GD and dN/dS indicates that gene-tree discordance is more rampant under higher strength of purifying selection. Selection against deleterious mutations may cause a reduction in the amount of genetic variability at linked neutral sites [59], and hence rapid removal of mutations may blur the evolutionary footprints of a lineage.
Conclusions
Our results presented here are the first to utilize a phylogenomic data set to investigate phylogenetic relationships among genera of Gentianeae. The phylogenomic framework lays the foundation for deep understanding of the evolutionary history of this diverse tribe. Comparative genomic analyses reveal both extensive evolutionary rate heterogeneity and genetic variation among plastid genes, supporting the view that plastid genes are not tightly linked as previously thought and are experiencing different evolutionary forces. Of the commonly used markers in phylogenetic inference of Gentianeae, only matK has high phylogenetic informativeness, while atpB may have a disproportionate influence on the resolution of contentious relationships. The rarely used gene rpoC2 is the top-performing gene, similar to the usefulness in the phylogenetic reconstruction of the angiosperm phylogeny, and hence is advocated as a promising plastid DNA barcode for taxonomic studies of Gentianeae. Notably, the rampant phylogenetic discordance of gene tree was detected, highlighting the necessity of considering gene-tree heterogeneity into future phylogenomic studies.
Methods
Taxon sampling and sequencing
We sampled 10 species representing 10 genera of Gentianeae from the Qinghai-Tibet Plateau (QTP) and adjacent regions. Fresh leaves were collected in filed and were dried with silica gel for later DNA isolation. Our field collection followed the ethics and legality of the local government and was permitted by the government. The formal identification of the plant material was undertaken by the Herbarium of Kunming Institute of Botany (KUN), and voucher specimens are deposited at KUN (Additional file 1: Table S1). Total genomic DNA was extracted using Plant Genomic DNA Kit (DP305) from Tiangen Biotech (Beijing) Co., Ltd., China. Short-insert (500 bp) paired-end libraries were constructed with a TruSeq DNA Sample Prep Kit (Illumina, Inc., United States) following the manufacturer’s manual. Libraries were then sequenced on an Illumina HiSeq 4000 platform at Novogene Co., Ltd. in Kunming, Yunnan, China.
Plastome assembly and annotation
Quality assessment of raw reads was performed using Trimmomatic v.0.36 [60] by removing low-quality and adapter-contaminated reads. Subsequently, remaining high-quality reads were assembled into contigs using NOVOPlasty v.2.7.2 [61]. Following the description of Shen et al. [62], a seed-and-extend algorithm was employed with the plastome sequence of Swertia mussotii (Genbank accession: NC_031155.1) as the seed input, and other parameters were kept at default settings (see NOVOPlasty manual). Assembled plastomes were then annotated using Plastid Genome Annotator (PGA) [63]. Start/stop codons and intron/exon boundaries were checked manually based on published plastomes of Gentianeae as a reference. The tRNA genes were identified with tRNAscan-SE [64]. For comparation, a linear graphical map of all sequenced plastomes were visualized with OGDRAW [65].
Phylogenetic analyses
Twenty-nine taxa of Gentianeae (17 Gentianinae + 12 Swertiinae) and three outgroups (Coffea arabica, Coffea canephora and Galium aparine) were included in phylogenomic analyses (Additional file 1: Table S1). Both concatenated and coalescent analyses were conducted. For the concatenated approach, the common 76 protein coding genes (PCGs) were extracted using PhyloSuite v.1.1.15 [66] with subsequent manual modifications. The sequences of the 76 PCGs were aligned in batches with MAFFT v.7.313 using “G-INS-i” strategy and codon alignment mode, and then concatenated in PhyloSuite. Both partitioned and unpartitioned analyses were performed. For data partitioning, PartitionFinder v.1.0.1 [67] was implemented to determine optimal partitioning scheme and evolutionary model selection under the Bayesian Information Criterion (BIC). Maximum likelihood (ML) analysis was conducted in RAxML v.8.2.10 [68] under the “GTRGAMMA” model with the “rapid bootstrap” algorithm (1000 replicates). Bayesian inference (BI) was performed using MrBayes v.3.2.3 [69] with four Markov chains (one cold and three heated) running for 5,000,000 generations from a random starting tree and sampled every 5000 generations. The first 25% of the trees were discarded as burn-in, and the remaining trees were used to construct majority-rule consensus trees.
For the coalescent approach, individual gene trees were inferred separately in RAxML under the “GTRGAMMA” model. A bootstrap resampling of 500 replicates was employed for each run. Resulting unrooted gene trees were inputted into ASTRAL-III v.5.6.2 [46] to estimate the species tree with node supports calculated using local posterior probabilities.
Exploration of plastid gene tree landscape
To explore gene tree variations, we plotted the statistical distribution of trees with Robinson-Foulds algorithms [70], by calculating distances between unrooted trees using the R package TREESPACE v.1.0.0 [42] following the workflow of Goncalves et al. [18], and visualizing with ggplot2 v.2.2.1 [71]. Since TREESPACE only accepts groups of trees containing the same tips, we removed the rpl33 locus which was absent in some species. Additionally, we removed six species of Gentiana from analysis due to the loss of ndh genes: G. hexaphylla, G. oreodoxa, G. veitchiorum, G. ornate and G. caelestis. We also included two species trees inferred from concatenated and coalescent analyses. In total, the dataset consisted of 75 gene trees from 26 taxa and two species trees. We used the distance between gene trees and the coalescent species tree to estimate gene-tree discordance (GD) of plastid genes. Distances were calculated using the first two PCoAs estimated by TREESPACE.
In addition, partitioned coalescence support (PCS) was calculated for each PCG using scripts provided by Gatesy et al. [43] (https://github.com/dbsloan). PCS quantifies the positive or negative influence of each gene tree in a phylogenomic data set for clades supported by summary coalescence methods [43, 72]. We used the phylogenetic tree generated by ASTRAL-III as the optimal species tree topology, and the tree inferred by RAxML as an alternative species tree.
Nucleotide substitution rate analysis
To estimate rates of nucleotide substitution, nonsynonymous (dN), synonymous (dS), and the ratio of nonsynonymous to synonymous rates (dN/dS) were calculated in PAML v.4.9 [73] using the CODEML option with codon frequencies estimated using the F3 × 4 model. The phylogeny generated using the concatenated method was used as a constraint tree. Gapped regions were removed using “cleandata = 1” option. The “model = 0” option was used for allowing a single dN/dS value to vary among branches. Other parameters in the CODEML control file were left at default settings. For the comparisons between different functional groups of PCGs, we consolidated the 76 PCGs into nine groups, i.e. photosystem I (PSA), photosystem II (PSB), cytochrome B6f complex (PET), ATP synthase (ATP), rubisco large subunit (Rubisco), RNA polymerase (RPO), ribosomal proteins large subunit (RPL), ribosomal proteins small subunit (RPS) and NADH dehydrogenase (NDH), and other genes (OG, including ycf1, ycf2, ycf3, ycf4, accD, clpP, ccsA, cemA and matK). Detailed information of functional groups is provided in Table 2.
Genetic variation and phylogenetic informativeness of PCGs
We used nucleotide diversity (π) and the percent variability (PV) to represent genetic variation of PCGs. Percent variability of each PCG was estimated by dividing segregating sites (S, i.e. the number of variable positions) by the length of gene. Both π and S were calculated in the program DnaSP v.6.0.7 [74] using sequences of the 76 PCGs aligned by MAFFT separately. Net phylogenetic informativeness (PI) profiles of 76 PCGs were estimated in PhyDesign web application (http://phydesign.townsend.yale.edu/) [75] using HyPhy substitution rates algorithm for DNA sequences [76]. A relative-time ultrametric tree was reconstructed in the dnamlk program in PHYLIP [77] using concatenated ML tree inferred by RAxML. The converted relative-time ultrametric tree along with a concatenated matrix partitioned by 76 PCGs were used as input files in PhyDesign to calculate phylogenetic informativeness with default settings.
Correlation analysis
Correlation of nucleotide substitution rates (including dN, dS and dN/dS values of each gene) with gene-tree discordance (GD), nucleotide diversity (π), percent variability (PV) and phylogenetic informativeness (PI) were tested using cor function in R package stats v3.6.1 (https://www.rdocumentation.org/packages/stats). The function cor.test was used for calculating p-values with Pearson test.
Availability of data and materials
All sequences used in this study are available from the National Center for Biotechnology Information (NCBI) (accession numbers: MT228723- MT228732; see Additional file 1: Table S1).
Abbreviations
- BI:
-
Bayesian Inference
- BIC:
-
Bayesian Information Criterion
- CTAB:
-
Cetyl trimethylammonium bromide
- dN :
-
Nonsynonymous
- DnaSP:
-
DNA Sequences Polymorphism
- dS :
-
synonymous
- GD:
-
Gene-tree discordance
- GTR:
-
General time reversible
- IR:
-
Inverted repeat
- ILS:
-
Incomplete lineage sorting
- ITS:
-
Internal transcribed spacer of ribosomal DNA
- LSC:
-
Large single copy
- ML:
-
Maximum Likelihood
- MSC:
-
Multispecies coalescent
- NCBI:
-
National Center for Biotechnology Information
- NGS:
-
Next-generation sequencing
- PCoA:
-
Principal Coordinate Analysis
- PCG:
-
Protein-coding gene
- PCS:
-
Partitioned coalescence support
- PGA:
-
Plastid Genome Annotator
- PI:
-
Phylogenetic informativeness
- PV:
-
Percent variability
- QTP:
-
Qinghai-Tibet Plateau
- rRNA:
-
Ribosomal RNA
- SSC:
-
Small single copy
- tRNA:
-
Transfer RNA
References
Moore MJ, Dhingra A, Soltis PS, Shaw R, Farmerie WG, Folta KM, Soltis DE. Rapid and accurate pyrosequencing of angiosperm plastid genomes. BMC Plant Biol. 2006;6:17.
Stull GW, Moore MJ, Mandala VS, Douglas NA, Kates HR, Qi X, Brockington SF, Soltis PS, Soltis DE, Gitzendanner MA. A targeted enrichment strategy for massively parallel sequencing of angiosperm plastid genomes. Appl Plant Sci. 2013;1.
Cronn R, Liston A, Parks M, Gernandt DS, Shen R, Mockler T. Multiplex sequencing of plant chloroplast genomes using Solexa sequencing-by-synthesis technology. Nucleic Acids Res. 2008;36:e122.
Wicke S, Schneeweiss GM, dePamphilis CW, Muller KF, Quandt D. The evolution of the plastid chromosome in land plants: gene content, gene order, gene function. Plant Mol Biol. 2011;76:273–97.
Ruhlman TA, Jansen RK. The plastid genomes of flowering plants. In: Maliga P, editor. Chloroplast biotechnology: methods and protocols. Totowa, NJ: Humana Press; 2014. p. 3–38.
Jansen RK, Cai Z, Raubeson LA, Daniell H, Depamphilis CW, Leebens-Mack J, Muller KF, Guisinger-Bellian M, Haberle RC, Hansen AK, et al. Analysis of 81 genes from 64 plastid genomes resolves relationships in angiosperms and identifies genome-scale evolutionary patterns. Proc Natl Acad Sci U S A. 2007;104:19369–74.
Moore MJ, Bell CD, Soltis PS, Soltis DE. Using plastid genome-scale data to resolve enigmatic relationships among basal angiosperms. Proc Natl Acad Sci U S A. 2007;104:19363–8.
Ruhfel BR, Gitzendanner MA, Soltis PS, Soltis DE, Burleigh JG. From algae to angiosperms-inferring the phylogeny of green plants (Viridiplantae) from 360 plastid genomes. BMC Evol Biol. 2014;14:23.
Gitzendanner MA, Soltis PS, Wong GK, Ruhfel BR, Soltis DE. Plastid phylogenomic analysis of green plants: a billion years of evolutionary history. Am J Bot. 2018;105:291–301.
Li HT, Yi TS, Gao LM, Ma PF, Zhang T, Yang JB, Gitzendanner MA, Fritsch PW, Cai J, Luo Y, et al. Origin of angiosperms and the puzzle of the Jurassic gap. Nat Plants. 2019;5:461–70.
Parks M, Cronn R, Liston A. Increasing phylogenetic resolution at low taxonomic levels using massively parallel sequencing of chloroplast genomes. BMC Biol. 2009;7:84.
Yan M, Fritsch PW, Moore MJ, Feng T, Meng A, Yang J, Deng T, Zhao C, Yao X, Sun H, et al. Plastid phylogenomics resolves infrafamilial relationships of the Styracaceae and sheds light on the backbone relationships of the Ericales. Mol Phylogenet Evol. 2018;121:198–211.
Sun Y, Moore MJ, Zhang S, Soltis PS, Soltis DE, Zhao T, Meng A, Li X, Li J, Wang H. Phylogenomic and structural analyses of 18 complete plastomes across nearly all families of early-diverging eudicots, including an angiosperm-wide analysis of IR gene content evolution. Mol Phylogenet Evol. 2016;96:93–101.
Walker JF, Walker-Hale N, Vargas OM, Larson DA, Stull GW. Characterizing gene tree conflict in plastome-inferred phylogenies. PeerJ. 2019;7:e7747.
Green BR. Chloroplast genomes of photosynthetic eukaryotes. Plant J. 2011;66:34–44.
Schwarz EN, Ruhlman TA, Weng ML, Khiyami MA, Sabir JSM, Hajarah NH, Alharbi NS, Rabah SO, Jansen RK. Plastome-wide nucleotide substitution rates reveal accelerated rates in Papilionoideae and correlations with genome features across legume subfamilies. J Mol Evol. 2017;84:187–203.
Guisinger MM, Kuehl JV, Boore JL, Jansen RK. Genome-wide analyses of Geraniaceae plastid DNA reveal unprecedented patterns of increased nucleotide substitutions. Proc Natl Acad Sci U S A. 2008;105:18424–9.
Goncalves DJP, Simpson BB, Ortiz EM, Shimizu GH, Jansen RK. Incongruence between gene trees and species trees and phylogenetic signal variation in plastid genes. Mol Phylogenet Evol. 2019;138:219–32.
Wolfe KH, Li WH, Sharp PM. Rates of nucleotide substitution vary greatly among plant mitochondrial, chloroplast, and nuclear DNAs. Proc Natl Acad Sci U S A. 1987;84:9054–8.
Weng ML, Ruhlman TA, Jansen RK. Plastid-nuclear interaction and accelerated coevolution in plastid ribosomal genes in Geraniaceae. Genome Biol Evol. 2016;8:1824–38.
Dugas DV, Hernandez D, Koenen EJ, Schwarz E, Straub S, Hughes CE, Jansen RK, Nageswara-Rao M, Staats M, Trujillo JT, et al. Mimosoid legume plastome evolution: IR expansion, tandem repeat expansions, and accelerated rate of evolution in clpP. Sci Rep. 2015;5:16958.
Sloan DB, Alverson AJ, Wu M, Palmer JD, Taylor DR. Recent acceleration of plastid sequence and structural evolution coincides with extreme mitochondrial divergence in the angiosperm genus Silene. Genome Biol Evol. 2012;4:294–306.
Moore MJ, Soltis PS, Bell CD, Burleigh JG, Soltis DE. Phylogenetic analysis of plastid genes further resolves the early diversification of eudicots. Proc Natl Acad Sci U S A. 2010;107:4623–8.
Degnan JH, Rosenberg NA. Gene tree discordance, phylogenetic inference and the multispecies coalescent. Trends Ecol Evol. 2009;24:332–40.
Edwards SV, Xi Z, Janke A, Faircloth BC, McCormack JE, Glenn TC, Zhong B, Wu S, Lemmon EM, Lemmon AR, et al. Implementing and testing the multispecies coalescent model: a valuable paradigm for phylogenomics. Mol Phylogenet Evol. 2016;94:447–62.
Simmons MP, Gatesy J. Coalescence vs. concatenation: sophisticated analyses vs. first principles applied to rooting the angiosperms. Mol Phylogenet Evol. 2015;91:98–122.
Zhu A, Guo W, Gupta S, Fan W, Mower JP. Evolutionary dynamics of the plastid inverted repeat: the effects of expansion, contraction, and loss on substitution rates. New Phytol. 2016;209:1747–56.
Guisinger MM, Kuehl JV, Boore JL, Jansen RK. Extreme reconfiguration of plastid genomes in the angiosperm family Geraniaceae: rearrangements, repeats, and codon usage. Mol Biol Evol. 2011;28:583–600.
Weng ML, Ruhlman TA, Jansen RK. Expansion of inverted repeat does not decrease substitution rates in Pelargonium plastid genomes. New Phytol. 2017;214:842–51.
Weng ML, Blazier JC, Govindu M, Jansen RK. Reconstruction of the ancestral plastid genome in Geraniaceae reveals a correlation between genome rearrangements, repeats, and nucleotide substitution rates. Mol Biol Evol. 2014;31:645–59.
Sun Y, Moore MJ, Lin N, Adelalu KF, Meng A, Jian S, Yang L, Li J, Wang H. Complete plastome sequencing of both living species of Circaeasteraceae (Ranunculales) reveals unusual rearrangements and the loss of the ndh gene family. BMC Genomics. 2017;18:592.
Knox EB. The dynamic history of plastid genomes in the Campanulaceae sensu lato is unique among angiosperms. Proc Natl Acad Sci U S A. 2014;111:11097–102.
Rabah SO, Shrestha B, Hajrah NH, Sabir MJ, Alharby HF, Sabir MJ, Alhebshi AM, Sabir JSM, Gilbert LE, Ruhlman TA, et al. Passiflora plastome sequencing reveals widespread genomic rearrangements. J Syst Evol. 2019;57:1–14.
Guisinger MM, Chumley TW, Kuehl JV, Boore JL, Jansen RK. Implications of the plastid genome sequence of Typha (Typhaceae, Poales) for understanding genome evolution in Poaceae. J Mol Evol. 2010;70:149–66.
Shrestha B, Weng ML, Theriot EC, Gilbert LE, Ruhlman TA, Krosnick SE, Jansen RK. Highly accelerated rates of genomic rearrangements and nucleotide substitutions in plastid genomes of Passiflora subgenus Decaloba. Mol Phylogenet Evol. 2019;138:53–64.
Struwe L, Kadereit JW, Klackenberg J, Nilsson S, Thiv M, Von Hagen KB, Albert VA. Systematics, character evolution, and biogeography of Gentianaceae, including a new tribal and subtribal classification. In: Struwe L, Albert VA, editors. Gentianaceae: systematics and natural history. Cambridge: Cambridge University Press; 2002. p. 21–309.
KBv H, Kadereit JW. Phylogeny and flower evolution of the Swertiinae (Gentianaceae-Gentianeae): Homoplasy and the principle of variable proportions. Syst Bot. 2002;27:548–72 525.
Favre A, Yuan YM, Kupfer P, Alvarez N. Phylogeny of subtribe Gentianinae (Gentianaceae): biogeographic inferences despite limitations in temporal calibration points. Taxon. 2010;59:1701–11.
Yuan YM, Kupfer P. Molecular Phylogenetics of the subtribe Gentianinae (Gentianaceae) inferred from the sequences of internal transcribed spacers (ITS) of nuclear ribosomal DNA. Plant Syst Evol. 1995;196:207–26.
Yang LL, Li HL, Wei L, Yang T, Kuang DY, Li MH, Liao YY, Chen ZD, Wu H, Zhang SZ. A supermatrix approach provides a comprehensive genus-level phylogeny for Gentianales. J Syst Evol. 2016;54:400–15.
Favre A, Matuszak S, Sun H, Liu ED, Yuan YM, Muellner-Riehl AN. Two new genera of Gentianinae (Gentianaceae): Sinogentiana and Kuepferia supported by molecular phylogenetic evidence. Taxon. 2014;63:342–54.
Jombart T, Kendall M, Almagro-Garcia J, Colijn C. TREESPACE: statistical exploration of landscapes of phylogenetic trees. Mol Ecol Resour. 2017;17:1385–92.
Gatesy J, Sloan DB, Warren JM, Baker RH, Simmons MP, Springer MS. Partitioned coalescence support reveals biases in species-tree methods and detects gene trees that determine phylogenomic conflicts. Mol Phylogenet Evol. 2019;139:106539.
Xi HC, Sun Y, Xue CY. Molecular phylogeny of Swertiinae (Gentianaceae-Gentianeae) based on sequence data of ITS and matK. Plant Diversity Resourc. 2014;36:145–56.
Ho T-N, Liu S-W. The infrageneric classification of Gentiana (Gentianaceae). Bull Brit Mus Nat Hist, Bot. 1990;20:169–92.
Zhang C, Rabiee M, Sayyari E, Mirarab S. ASTRAL-III: polynomial time species tree reconstruction from partially resolved gene trees. BMC Bioinformatics. 2018;19:153.
Fu PC, Zhang YZ, Geng HM, Chen SL. The complete chloroplast genome sequence of Gentiana lawrencei var. farreri (Gentianaceae) and comparative analysis with its congeneric species. PeerJ. 2016;4:e2540.
Sun SS, Fu PC, Zhou XJ, Cheng YW, Zhang FQ, Chen SL, Gao QB. The complete Plastome sequences of seven species in Gentiana sect. Kudoa (Gentianaceae): insights into plastid gene loss and molecular evolution. Front. Plant Sci. 2018;9:493.
Martin M, Sabater B. Plastid ndh genes in plant evolution. Plant Physiol Biochem. 2010;48:636–45.
Mohanta TK, Khan A, Khan A, Abd Allah EF, Al-Harrasi A. Gene Loss and Evolution of the Plastome. bioRxiv. 2019; https://doi.org/10.1101/676304.
Rogalski M, Schottler MA, Thiele W, Schulze WX, Bock R. Rpl33, a nonessential plastid-encoded ribosomal protein in tobacco, is required under cold stress conditions. Plant Cell. 2008;20:2221–37.
Blazier JC, Ruhlman TA, Weng ML, Rehman SK, Sabir JS, Jansen RK. Divergence of RNA polymerase alpha subunits in angiosperm plastid genomes is mediated by genomic rearrangement. Sci Rep. 2016;6:24595.
Nei M, Li WH. Mathematical model for studying genetic variation in terms of restriction endonucleases. Proc Natl Acad Sci U S A. 1979;76:5269–73.
Neubig KM, Whitten WM, Carlsward BS, Blanco MA, Endara L, Williams NH, Moore M. Phylogenetic utility of ycf1 in orchids: a plastid gene more variable than matK. Plant Syst Evol. 2009;277:75–84.
Zhang X, Deng T, Moore MJ, Ji Y, Lin N, Zhang H, Meng A, Wang H, Sun Y, Sun H. Plastome phylogenomics of Saussurea (Asteraceae: Cardueae). BMC Plant Biol. 2019;19:290.
Dong W, Xu C, Li C, Sun J, Zuo Y, Shi S, Cheng T, Guo J, Zhou S. ycf1, the most promising plastid DNA barcode of land plants. Sci Rep. 2015;5:8348.
Philippe H, Brinkmann H, Lavrov DV, Littlewood DTJ, Manuel M, Worheide G, Baurain D. Resolving difficult phylogenetic questions: why more sequences are not enough. PLoS Biol. 2011;9:e1000602.
Wicke S, Schaferhoff B, dePamphilis CW, Muller KF. Disproportional plastome-wide increase of substitution rates and relaxed purifying selection in genes of carnivorous Lentibulariaceae. Mol Biol Evol. 2014;31:529–45.
Charlesworth B, Morgan MT, Charlesworth D. The effect of deleterious mutations on neutral molecular variation. Genetics. 1993;134:1289–303.
Bolger AM, Lohse M, Usadel B. Trimmomatic: a flexible trimmer for Illumina sequence data. Bioinformatics. 2014;30:2114–20.
Dierckxsens N, Mardulyn P, Smits G. NOVOPlasty: de novo assembly of organelle genomes from whole genome data. Nucleic Acids Res. 2017;45:e18.
Shen J, Zhang X, Landis JB, Zhang H, Deng T, Sun H, Wang H. Plastome evolution in Dolomiaea (Asteraceae, Cardueae) using Phylogenomic and comparative analyses. Front Plant Sci. 2020;11:376.
Qu XJ, Moore MJ, Li DZ, Yi TS. PGA: a software package for rapid, accurate, and flexible batch annotation of plastomes. Plant Methods. 2019;15:50.
Lowe TM, Eddy SR. tRNAscan-SE: a program for improved detection of transfer RNA genes in genomic sequence. Nucleic Acids Res. 1997;25:955–64.
Lohse M, Drechsel O, Kahlau S, Bock R. OrganellarGenomeDRAW--a suite of tools for generating physical maps of plastid and mitochondrial genomes and visualizing expression data sets. Nucleic Acids Res. 2013;41:W575–81.
Zhang D, Gao F, Jakovlic I, Zou H, Zhang J, Li WX, Wang GT. PhyloSuite: an integrated and scalable desktop platform for streamlined molecular sequence data management and evolutionary phylogenetics studies. Mol Ecol Resour. 2020;20:348–55.
Lanfear R, Calcott B, Ho SYW, Guindon S. PartitionFinder: combined selection of partitioning schemes and substitution models for phylogenetic analyses. Mol Biol Evol. 2012;29:1695–701.
Stamatakis A. RAxML version 8: a tool for phylogenetic analysis and post-analysis of large phylogenies. Bioinformatics. 2014;30:1312–3.
Huelsenbeck JP, Ronquist F. MRBAYES: Bayesian inference of phylogenetic trees. Bioinformatics. 2001;17:754–5.
Robinson DF, Foulds LR. Comparison of phylogenetic trees. Math Biosci. 1981;53:131–47.
Wickham H. Ggplot2: elegant graphics for data analysis. 2nd edition. New York: Springer-Verlag; 2016.
Gatesy J, Meredith RW, Janecka JE, Simmons MP, Murphy WJ, Springer MS. Resolution of a concatenation/coalescence kerfuffle: partitioned coalescence support and a robust family-level tree for Mammalia. Cladistics. 2017;33:295–332.
Yang Z. PAML 4: phylogenetic analysis by maximum likelihood. Mol Biol Evol. 2007;24:1586–91.
Rozas J, Ferrer-Mata A, Sanchez-DelBarrio JC, Guirao-Rico S, Librado P, Ramos-Onsins SE, Sanchez-Gracia A. DnaSP 6: DNA sequence polymorphism analysis of large data sets. Mol Biol Evol. 2017;34:3299–302.
Lopez-Giraldez F, Townsend JP. PhyDesign: an online application for profiling phylogenetic informativeness. BMC Evol Biol. 2011;11:152.
Pond SL, Frost SD, Muse SV. HyPhy: hypothesis testing using phylogenies. Bioinformatics. 2005;21:676–9.
Felsenstein J. PHYLIP – phylogeny inference package (version 3.2). Cladistics. 1989;5:164–6.
Acknowledgements
We would like to thank three anonymous reviewers for their thoughtful comments and constructive suggestions towards improving our manuscript.
Funding
This study was supported by the Key Projects of the Joint Fund of the National Natural Science Foundation of China (U1802232), the Second Tibetan Plateau Scientific Expedition and Research (STEP) program (2019QZKK0502), the National Key R&D Program of China (2017YFC0505200), the Strategic Priority Research Program of Chinese Academy of Sciences (XDA20050203), the Major Program of the National Natural Science Foundation of China (31590823). The funders had no role in study design, data collection and analysis, decision to publish, or preparation of the manuscript.
Author information
Authors and Affiliations
Contributions
HW and HS conceived and designed the study. XZ and YS performed de novo assembly, genome annotation and phylogenetic analyses. LZ, JS1, NL and TD conducted other analyses. XZ, YS, JBL, HW and HS drafted the manuscript. JS1, HZ, LL and JS2 performed the DNA extraction experiments. XZ, ZL, NL and TD collected the leaf materials. All authors discussed the results and helped shape the research, analyses and final manuscript.
Corresponding authors
Ethics declarations
Ethics approval and consent to participate
Not applicable.
Consent for publication
Not applicable.
Competing interests
The authors declare that they have no competing interests.
Additional information
Publisher’s Note
Springer Nature remains neutral with regard to jurisdictional claims in published maps and institutional affiliations.
Supplementary information
Additional file 1: Figure S1.
Loss of rpl33 coding region in plastomes of Comastoma pulmonarium and Swertia hispidicalyx. There is a stop codon in coding region of rpl33 in Comastoma pulmonarium due to the change of cytosine (C) to thymine (T) at 22 bp, and a small deletion containing the coding region of rpl33 between the psaJ and rps18 gene in the plastome of Swertia hispidicalyx. Figure S2. Maximum likelihood phylogram of Gentianeae from unpartitioned concatenated matrix of 76 plastid protein-encoding genes using RAxML. Maximum likelihood bootstrap (BS) values and the PP calculated from MrBayes are shown at nodes, except nodes with 100% BS and 1.0 PP. Figure S3. Phylogenetic informativeness profile estimated in PhyDesign. (A) The ultramteric tree of Gentianeae. (B) Net phylogenetic informativeness profile for 76 plastid protein-coding genes. Ten genes with the greatest informativeness are color-coded and indicated at the right. X- and Y-axes represent relative-time and net phylogenetic informativeness, respectively. Table S1. Taxa included in present study. Table S2. Genetic characteristics of 76 protein-coding genes.
Rights and permissions
Open Access This article is licensed under a Creative Commons Attribution 4.0 International License, which permits use, sharing, adaptation, distribution and reproduction in any medium or format, as long as you give appropriate credit to the original author(s) and the source, provide a link to the Creative Commons licence, and indicate if changes were made. The images or other third party material in this article are included in the article's Creative Commons licence, unless indicated otherwise in a credit line to the material. If material is not included in the article's Creative Commons licence and your intended use is not permitted by statutory regulation or exceeds the permitted use, you will need to obtain permission directly from the copyright holder. To view a copy of this licence, visit http://creativecommons.org/licenses/by/4.0/. The Creative Commons Public Domain Dedication waiver (http://creativecommons.org/publicdomain/zero/1.0/) applies to the data made available in this article, unless otherwise stated in a credit line to the data.
About this article

Cite this article
Zhang, X., Sun, Y., Landis, J.B. et al. Plastome phylogenomic study of Gentianeae (Gentianaceae): widespread gene tree discordance and its association with evolutionary rate heterogeneity of plastid genes. BMC Plant Biol 20, 340 (2020). https://doi.org/10.1186/s12870-020-02518-w
Received:
Accepted:
Published:
DOI: https://doi.org/10.1186/s12870-020-02518-w