- 1 The winter wheat cultivars Jinmai 92, Bainong 207 and Pumai 9 were sampled from Yuncheng, Zhoukou and Nanyang cities, respectively, for the isolation of endophytic bacteria
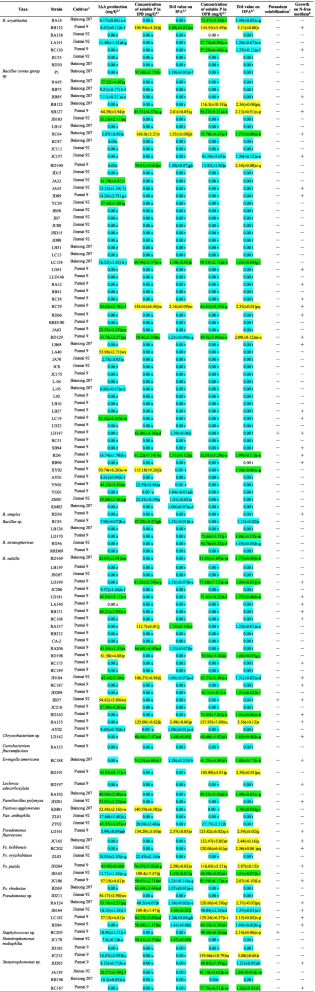
- 2 Yellow, green, and blue shadows distinguish high- (≥ 50 mg/l), moderate- (20.00–49.99 mg/l) and low-levels (0.00–19.99 mg/l), respectively, of IAA production
- 3 Yellow, green, and blue shadows distinguish high- (≥ 100 mg/l), moderate- (50.00–99.99 mg/l) and low-levels (0–49.99 mg/l), respectively, of phosphate solubilising activity in IPB (inorganic phosphate broth)
- 4 Yellow, green, and blue shadows distinguish high- (D/d ≥ 2.00), moderate- (1.50 ≤ D/d < 2.00) and low-levels (D/d < 1.50), respectively, of phosphate solubilising activity in IPA (inorganic phosphate agar). D/d value = total diameter (colony + halo zone)/colony diameter (Kumar and Narula, 1999)
- 5 Yellow, green, and blue shadows distinguish high- (≥ 100 mg/l), moderate- (50.00–99.99 mg/l) and low-levels (0–49.99 mg/l), respectively, of phosphorus solubilising activity in OPB (organic phosphorus broth)
- 6 Yellow, green, and blue shadows distinguish high- (D/d ≥ 2.00), moderate- (1.50 ≤ D/d < 2.00) and low-levels (D/d < 1.50 mg/l), respectively, of phosphorus solubilising activity in OPA (organic phosphorus agar)
- 7,8 ′ + ′ represents positive reactions or growth; ′-′ represents negative reactions or no growth
- * Different lowercase letters in the same column indicate significant differences at P ≤ 0.05 (ANOVA with Duncan’s post-test)
