- Research article
- Open access
- Published:
Mapping freezing tolerance QTL in alfalfa: based on indoor phenotyping
BMC Plant Biology volume 21, Article number: 403 (2021)
Abstract
Background
Winter freezing temperature impacts alfalfa (Medicago sativa L.) persistence and seasonal yield and can lead to the death of the plant. Understanding the genetic mechanisms of alfalfa freezing tolerance (FT) using high-throughput phenotyping and genotyping is crucial to select suitable germplasm and develop winter-hardy cultivars. Several clones of an alfalfa F1 mapping population (3010 x CW 1010) were tested for FT using a cold chamber. The population was genotyped with SNP markers identified using genotyping-by-sequencing (GBS) and the quantitative trait loci (QTL) associated with FT were mapped on the parent-specific linkage maps. The ultimate goal is to develop non-dormant and winter-hardy alfalfa cultivars that can produce extended growth in the areas where winters are often mild.
Results
Alfalfa FT screening method optimized in this experiment comprises three major steps: clone preparation, acclimation, and freezing test. Twenty clones of each genotype were tested, where 10 samples were treated with freezing temperature, and 10 were used as controls. A moderate positive correlation (r ~ 0.36, P < 0.01) was observed between indoor FT and field-based winter hardiness (WH), suggesting that the indoor FT test is a useful indirect selection method for winter hardiness of alfalfa germplasm. We detected a total of 20 QTL associated with four traits; nine for visual rating-based FT, five for percentage survival (PS), four for treated to control regrowth ratio (RR), and two for treated to control biomass ratio (BR). Some QTL positions overlapped with WH QTL reported previously, suggesting a genetic relationship between FT and WH. Some favorable QTL from the winter-hardy parent (3010) were from the potential genic region for a cold tolerance gene CBF. The BLAST alignment of a CBF sequence of M. truncatula, a close relative of alfalfa, against the alfalfa reference showed that the gene’s ortholog resides around 75 Mb on chromosome 6.
Conclusions
The indoor freezing tolerance selection method reported is useful for alfalfa breeders to accelerate breeding cycles through indirect selection. The QTL and associated markers add to the genomic resources for the research community and can be used in marker-assisted selection (MAS) for alfalfa cold tolerance improvement.
Background
Most of the U.S. regions experience freezing to extremely low temperatures in winter posing a serious threat to the survival of herbaceous forage species. Severe winter injury in alfalfa is frequent especially in the northern climate [1, 2]. Harsh winters affect alfalfa (Medicago sativa L.) growth leading to reduced biomass yield, low stand persistence, and eventually death (http://www.canr.msu.edu/uploads/resources/pdfs/e2310.pdf). Improvement of alfalfa for winter hardiness (WH) has traditionally been achieved via mass and recurrent selection of superior genotypes in field nurseries in cold regions [3]. However, selection for cold hardiness in nurseries has often low efficiency because of the unpredictable winter season and the requirement of data from multiple locations and years for efficient selection [3]. Recording several data for multiple seasons is costly and laborious [4]. The North American Alfalfa Improvement Conference (NAAIC) also recommends data collection for a minimum of two locations and two years for winter survival evaluation (https://www.naaic.org/stdtests/wintersurvivalnew.pdf). The NAAIC also recommends some guidelines for the collection and interpretation of alfalfa winter survival data as the winter survival ratings recorded too early can underestimate the WH of dormant genotypes. Also, alfalfa selection against winter damage based on conventional breeding is too slow as the trait is quantitative and has substantial interaction with the environment [5]. Therefore, the assessment of WH in the field is a relatively tedious and long process.
Alfalfa is an autotetraploid (2n = 4x = 32) and the most widely cultivated forage globally [6]. Freezing tolerance (FT) is an important factor for predicting alfalfa winter hardiness (WH) [7]. Therefore, the evaluation of plant tolerance to freezing temperatures in a simulated environment is deemed as an alternative to field phenotyping. The indoor freezing tolerance tests are commonly carried out using a temperature bath [8], as electrolytic leakage assessment [9], using chlorophyll fluorescence assays [10], and freezer chambers with programmed temperatures [3]. The better nursery performance of plants selected from the indoor freezing test has been described in alfalfa [3, 11] and other species. Adkins et al. (2002) evaluated the cold hardiness of ten species of the genus Hydrangea in the lab, where they observed the performances of H. macrophylla cultivars corresponding to their landscape performance [12]. A strong positive correlation between the freezing test and plant cold hardiness was reported for St. Augustinegrass [Stenotaphrum secundatum (Walt.) Kuntze] [13].
Low temperature induces several genes and associated signal transduction pathways to synthesize essential biomolecules (proteins, soluble sugars, osmoprotectants) for cold acclimation [14]. The CBF (C-repeat binding factor) genes are transcription factors that play a key role in cold acclimation regardless of the source of temperatures [15, 16]. Cold-sensitive plants often lack the associated genes, or the genes get inactivated due to mutations thereby dysregulating the formation of regulatory and signaling molecules for cold acclimation. Other factors such as water stress, pesticide application, fertilizer treatment, bacterial colonization, and planting date [8] also affect plant cold hardiness. However, low temperature is the major factor bringing cellular changes and winter injuries in sensitive plants. Therefore, dissecting the genomic features associated with alfalfa freezing tolerance is crucial. Furthermore, some alfalfa germplasm, generally the cold-tolerant types, undergo dormancy when the days shorten and temperature drops in fall season and this phenomenon is called fall dormancy (FD). Nevertheless, recent findings indicated that winter survival (WS), the tendency of plants to withstand winter cold without injuries, and FD are two distinct traits and can be genetically separated to improve germplasm for both traits simultaneously [17]. Incorporation of cold tolerance in non-dormant alfalfa germplasm through genetic manipulation could be ideal for developing alfalfa cultivars that have high biomass yield and winter survival.
QTL analysis for identifying effective loci and genomic regions associated with traits of interest has been a common approach in crop breeding and genomics studies for the last couple of decades [18]. Poudel et al. [19] conducted QTL analysis on freezing tolerance in pseudo-F2 switchgrass population based on indoor phenotyping and reported six significant QTL and potential candidate genes. Recently, a group of researchers reported multiple QTL for cold acclimation and freezing tolerance related traits such as surviving green tissue and regrowth in Zoysiagrasses (Zoysia spp.) [20]. QTL analysis also revealed the genetic basis for adaptive freezing tolerance in locally adapted Arabidopsis thaliana populations from Italy and Sweden [21]. The closest diploid relative of alfalfa, Medicago truncatula was also investigated to detect QTL associated with the freezing damage and related traits such as foliar electrolyte leakage, chlorophyll content index, and dry weights [22]. The authors reported QTL on different linkage groups (LG) of M. truncatula: LG1, LG4, and LG6, where the freezing tolerance related QTL in LG6 was the most effective QTL explaining up to 40 % variation. In alfalfa, information is limited regarding effective freezing tolerance QTL that could also be useful for overall winter survival improvement of germplasm.
Winter-hardy non-dormant alfalfa with wider adaptation can fill the forage gap through the extension of regrowth time in winter and early spring. Seasonal forage gaps exist because of partial to complete growth cessation of warm-season species when cool-season forages are not productive yet [17]. Winters in Georgia and the southeast USA are overall mild, but these locations often experience a few freezing days per season depending on the latitude and elevation. Therefore, non-dormant and winter-hardy alfalfa are desirable to the region. In a previous study, we reported QTL associated with alfalfa WH and fall dormancy in field-grown plants [17].
In this study, we investigated the association of freezing tolerance with genetic loci using indoor phenotyping in freeze chambers. Accordingly, the objectives of this experiment were (i) to optimize a protocol for alfalfa freezing tolerance test in a walk-in freezer (ii) to identify alfalfa QTL associated with freezing tolerance, and (iii) to select freeze-tolerant advanced alfalfa breeding lines for the development of winter-hardy cultivars.
Results
Testing freezing tolerance
The standard check seedlings in control and treatment sets of cultivars 5262 (WS = 2) and G-2852 (WS = 4) showed significant differences (P < 0.05) (Fig. 1) when the freezing environment was adjusted in such a way that the minimum testing temperature was -8 °C. The optimized protocol included a series of combinations of temperatures and durations of exposure. After acclimation, both treatment and control plant sets were maintained at 0 °C for 8 hr. Then, the control set was removed from the freezing chamber and transferred to normal growing conditions at 14 hr. of light (23 °C) and 10 hr. of dark (15 °C). Plants in the treatment sets were treated in such a way that the temperature was decreased by 2 °C/hr until it reached -8 °C. The plants were maintained for 90 min at -8 °C, then the temperature in the chamber was raised gradually by 2 °C/hr until it reached 2 °C. The treated plants were then transferred to the normal greenhouse condition for phenotyping.

Regrowth pattern of indoor freeze-tested alfalfa plants from the treatment group (left) and the control group (right) after two weeks of freezing test. Some tested genotypes in the treatment group had good regrowth while some of them could not survive
Phenotypic variation and distribution
Phenotypic variability was noticed among the F1 individuals for all four traits: freezing tolerance (FT), percentage survival (PS), regrowth ratio (RR), and biomass ratio (BR) (Figs. 1 and 2). All traits showed the nearly normal variability distribution within the population, where the highest number of samples had average trait values. Analysis of variance (ANOVA) for the traits like regrowth height and biomass assuming the traits values as a function of genotypes and replications showed that only genotypes have significant (P < 0.05) effects. We also noticed transgressive segregants for all four traits. The PS of cold-treated genotypes ranged from 7 to 100 %. The mean RR of surviving plants in treatment versus control ranged from completely sensitive (near 0) to almost completely tolerant (~ 1) genotypes (Fig. 2). Similarly, the mean BR of surviving plants in treatment and control sets ranged from 0.01 to 0.99. The average visual rating based FT of F1 plants varied from 1 to 4.9, indicating sufficient variation present in the F1 genotypes for freezing temperature tolerance. The genotypes with higher PS, RR, and BR, and lower FT were considered cold hardy genotypes. The PS showed a strong negative correlation (r = -0.91, P < 0.01) with mean FT, which means that the higher the % of the surviving clones, the better is the freezing tolerance of the genotypes (Table 1). The significant positive correlations (r = 0.55, P < 0.001) between PS and RR as well as PS and BR (r = 0.40, P < 0.01) indicated that the genotypes with higher % survival produced higher regrowth and subsequently higher biomass. Strong negative correlations were also observed between variables FT and RR, suggesting that the cold-sensitive genotypes had a low regrowth. Similarly, significant negative correlations (r = -0.46, P < 0.01) were obtained between BR and FT as with moderate correlation values (Table 1).

Distribution of mean of regrowth ratio (RR) computed for treated vs. a control group of plants among indoor tested alfalfa bi-parental (3010 x CW 1010) F1 progenies. The data is available for 179 progenies and the trait values exhibited near to normal distribution
We found a significant positive correlation (r = 0.36, P < 0.01) between mean FT and the least square (LS) mean of WH scores collected at the JPC field location in 2017 (WH017JPC). A significant positive correlation (r = 0.23, P < 0.01) was also observed between FT and WH data from Blairsville location (BVL) in 2017 (WH017BVL) (Table 1). Besides FT, other variables, such as PS, RR, and BR, from indoor testing also displayed significant correlations (P < 0.05) with WH data from the field (Table 1). However, we could not find significant correlations (P < 0.05) between field data for BVL and the variables PS, RR, and BR. However, the direction of the relationship between them was similar to that exhibited by the JPC field data. These relationships among the traits indicated the values of the phenotyping method used.
QTL mapping
As we generated two groups of relatively dense (1.5 cM/SNPs) linkage maps specific to each parent, we mapped QTL separately on them. In this study, we detected a total of 20 QTL for four traits (Table 2). The QTL that were detected on the linkage map of the dormant (d) parent (3010) were coded as ‘d’ followed by the trait name (in lower case abbreviation) and numbers. For example, dft1, dft2,…, dft5 represent different QTL detected on the dormant parent map for the freezing tolerance (Fig. 3). The QTL mapped on the non-dormant (n) parent linkage map were coded using the same approach just by replacing ‘d’ by ‘n’, e.g., freezing tolerance QTL of the non-dormant parent were named as nft1, nft2, and so on (Table 2).
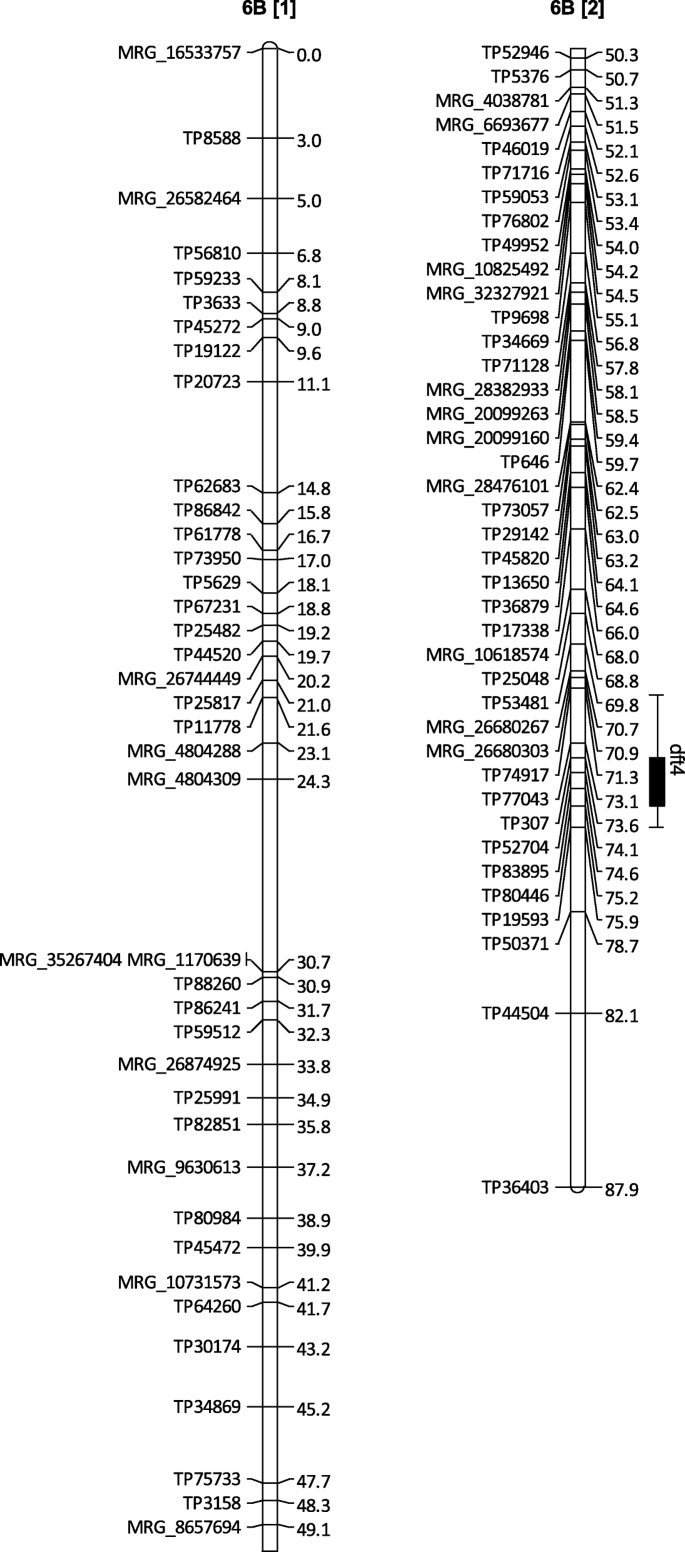
Linkage map of homolog 6B for the maternal parent (3010) where two maps 6B [1] and 6B [2] indicate two portions of a single linkage map 6B. The map shows a QTL (dft4) for freezing tolerance. The rectangle of the QTL bar represents an inner (1-LOD support) interval, and the line of the bar indicates an outer (2-LOD support) interval
Of five QTL detected for FT on 3010 linkage maps, two were on homolog 3 C, one on 4B, one each on 6B, and 6D (Table 2). Among the five FT QTL from the maternal parent, the QTL dft1 (R2 = 0.19) explained the highest phenotypic variation. Since we used only a single dose allele locus for linkage grouping that represents only a portion of the loci responsible for the trait in autotetraploid species, here we reported only the direction of allelic effects instead of actual additive effects. Of the five FT related QTL from the 3010 parent, only two QTL (dft4 and dft5) on chromosome 6 homologs (Table 2; Fig. 3) had positive effects for freezing tolerance while the other three were enhancing freezing sensitivity. We detected two QTL for RR (drr1 and drr2), two QTL for BR (dbr1 and dbr2), and only one QTL for PS (dps1) on the 3010 linkage maps (Table 2). Of the 10 QTL reported for the 3010 (winter-hardy) parent, five QTL exhibited favorable loci with positive impacts on the freezing tolerance-related traits (Table 2).
We identified four QTL for FT, four for PS, and two for RR on the linkage groups of CW 1010 (Table 2). For FT, we identified three of four QTL on 5B of CW 1010, where a QTL (nft3) explained the phenotypic variation up to 29 %. Also, two QTL for PS (nps1 and nps2) were reported in the same region on 5B for CW 1010. These five QTL: nft3, nps1 (overlapping), nft4, nps2 (overlapping), and nft2 on 5B of CW 1010 with negative effect suggested that the chromosomal segment is crucial for freezing sensitivity in alfalfa. We also observed two QTL for regrowth ratio (nrr1 and nrr2) for this paternal parent on chromosomes 4D and 8D (Table 2). Of the total 10 QTL identified for CW 1010 (cold-sensitive parent), only one QTL (nft1) had a favorable (+) effect for alfalfa freezing tolerance that explained only 11 % (R2 = 0.11) of the phenotypic variation. This output affirms the reliability of the trait value we used.
Some QTL identified in this experiment overlapped with genomic regions of WH-related QTL reported previously. The QTL nrr1 on chromosome 4D was detected in the same chromosomal region where the QTL ws10 was detected [17]. The QTL nrr2 reported here also overlapped with ws5 on chromosome 8D of CW 1010 parent [17]. Another QTL dbr1 of 3010 on chromosome 2B was identified in the proximal region where winter hardiness QTL wh15 and dormancy-related QTL dorm16 were detected [17]. The direction of the allelic effect of these QTL overlapped and matched in both phenotyping conditions. Also, in this study, we detected major QTL on various homologs of chromosomes 2, 3, 4, 5, 6, and 7. Another experiment also reported major winter injury-related QTL on linkage groups 2, 3, 4, 5, 6, and 7 [23]. These pieces of evidence support the genetic relationship between freezing tolerance and field cold survival. The tag sequences of flanking and peak markers of the QTL were provided (Supplementary File S1) can be used as potential markers for marker-assisted selection (MAS).
CBF ortholog and relevant freezing tolerance QTL
Sequence alignment of a CBF gene (Supplementary File S2) of M. truncatula on alfalfa reference using the BLAST algorithm showed the alfalfa CBF orthologs exist around 75 Mb on chromosome 6 (Table 3). Since the alfalfa available reference has only eight chromosomes assigned [24], and it lacks sequence information for all four homologs of chromosome 6, we were not able to know if all homologs of chromosome 6 possess CBF genes. Also, we observed 91 % maximum identities when M. truncatula CBF orthologs aligned on alfalfa reference, suggesting that changes have occurred in the gene while evolving alfalfa from M. truncatula. A most interesting observation is that the CBF best BLAST hits occurred in the vicinity of the genomic region 75.72 to 75.77 Mb on chromosome 6, which suggests multiple genes of CBF families in the region.
When we aligned the tag sequences (~ 60 bp) of markers related to the cold tolerance QTL: dft4 (chromosome 6B) and dft5 (chromosome 6D), we observed the dft4 related markers tag sequences best BLAST hit occurred around 120 Mb and dft5 related markers tag sequences best aligned around 10 Mb on chromosome 6. There could be multiple reasons behind the non-overlapping of the positions of CBF ortholog and dft4 markers, such as we might have missed detecting CBF loci since we only used SDA SNPs. Because of the lack of sequences of all four homologs of alfalfa in the reference genome, we have currently no way to know exactly where the CBF resides on the homologs and how many different copies of the gene are there. Also, a very short tag sequence (~ 60 bp) alignment could be questioned. Nevertheless, the recently published reference genome of alfalfa and the available cloned gene of M. truncatula provided us an opportunity to determine the potential location of alfalfa orthologs of a cold tolerance gene.
Indoor screened breeding material
After consecutive cycles of freezing tolerance testing, selection, and polycrossing, we developed 177 half-sib families. At the University of Georgia (UGA) research farm at Blairsville, GA, these lines were screened in the field for cold hardiness together with winter survival and fall dormancy standard checks. The fully established plants showed better winter survival (40–70 % stand count) after the 2019–2020 winter. Nonetheless, the winter survival checks exhibited 16–80 % survival. The winter survival checks: ZG9830 and WL325HQ showed up to 80 % of survival whereas CUF 101 showed only 16 % survival. Further, the fall dormancy (FD) check UC-1465 died completely after the winter frost, whereas another FD check ABI 700 (semi-dormant) had only a 10 % survival. These observations indicated that better survival of some winter survival checks is probably due to their dormant nature. Since the winters in Blairsville, GA are mostly severe with 29.3 °F (-1.5 °C) average low temperature in January (https://www.weather-us.com/en/georgia-usa/blairsville-climate), the non-dormant alfalfa germplasm that tolerates the harsh winter with better cold tolerance ability constitutes an improved genetic resource for cold-hardy alfalfa cultivar development.
Discussion
Alfalfa indoor screening for freeze tolerance
The indoor freezing tolerance selection method we reported here is relatively faster and cheaper than field selection as it takes only a few hours in a freezer after acclimation. All the steps are conducted in a controlled environment and hence the freezing test can overcome the difficulties associated with the field phenotyping mainly environmental variability and the unpredictable winters. Past studies have established that alfalfa winter hardiness in the field is influenced by the ability of genotypes to tolerate and survive freezing [7], suggesting an optimized freezing test is valuable. This indoor FT selection also enables the screening of a large number of accessions at the same time; normally, we tested a set of 196 (98 × 2) clones grown in cones that included both control and treatment groups. Nonetheless, the indoor-selected alfalfa may also require few cycles of field selection before the release as a cold-tolerant cultivar. A previous study indicated that indoor selected alfalfa plant progeny showed an increase in freezing tolerance up to 5˚C and superior winter survival [3].
In mild winter areas where the winters have occasional frost and fluctuating temperatures, the condition can be damaging to perennial forages such as alfalfa with the non-dormant types being especially more vulnerable. When winters are warm with a temperature near 13 °C, over-wintering alfalfa breaks dormancy and starts new growth with elongated crown buds (http://www.canr.msu.edu/uploads/resources/pdfs/e2310.pdf), the phenomenon is known as deacclimation [25]. The process depletes alfalfa root reserves, which eventually makes the plant susceptible to low temperatures (http://www.canr.msu.edu/uploads/resources/pdfs/e2310.pdf). Thus, the sensitive genotypes fail to reacclimatize when frost returns in late winter and early spring (Fig. 4). Therefore, it seems that the efficiency of the freezing test would be enhanced by the freezing of the already tested (deacclimated) clones one more time. In other words, a simulated environment that involves a series of acclimation-deacclimation-reacclimation processes could be ideal for future freezing tests in alfalfa.

Winter frost tolerant (left) and sensitive (right) alfalfa F1 progenies. The sensitive alfalfa has very distinct frost damage symptoms. The image was taken after frost occurrence in the first week of March 2017 at Watkinsville, GA. Before the frost, the winter was mild, and the alfalfa had gained sufficient regrowth
Clonal variations
One of the challenges encountered in the alfalfa indoor cold test was to generate identical clones by stem cuttings. The clonal variation is not unusual and such variation among clones of stem cuttings of the same genotype is commonly experienced in alfalfa. Perhaps the uncontrolled source of variability is attributable to the vigor of establishment and the interaction with the environment (watering, location in the growth chamber, etc.) (Yves Castonguay, personnel communication, 2016). This effect can be minimized by making multiple clonal propagules for each genotype and using vigorous clones of uniform size for freezing treatment. When resources are not limited, producing a large number of cuttings and testing more uniform clones could be effective to avoid the uncontrolled source of variability among clones. In this study, since the tested clones were selected carefully for their uniformity, there were no significant variations (P < 0.05) among the surviving replicated clones of a genotype for the traits like regrowth and biomass. However, we found different levels of survival (PS) within the clones of a single genotype after exposure to freezing, suggesting that PS is a quantitative trait and varies from genotype to genotype. The phenotypic variation present in clones, which is also known as somaclonal variation, could be the result of other factors such as epigenetic changes [26].
FT and WH relationship
The moderate positive correlation (r = 0.23 to 0.36) observed between indoor cold screening and field WH rating (Table 1) indicated that WH selection in the field can be accelerated by screening alfalfa in the freezing chambers. Some past studies also reported similar information. Brouwer et al. [7] found a positive correlation (r = 0.34 to 0.58) between freezing injury and winter injury in field conditions and suggested that freezing tolerance and WH are potentially controlled by some common genetic mechanism. A breeding population developed using indoor selected parents accelerated the breeding process [3]. For instance, superior freeze-tolerant cultivars like Apica (ATF0) and (ATF5) were developed using recurrent selection for up to five cycles [27]. The results from this study and past reports indicated that an indoor freezing test can be useful in indirectly selecting alfalfa winter hardiness.
Winter hardiness is a broad term that refers to the plant’s ability to withstand harsh winters, which encompasses freezing temperature, diseases, high moisture level, ice formation, and frost-heaving (https://extension.umaine.edu/publications/2272e/) [28]. Therefore, selecting only based on FT represents only a part of the spectrum of variables and breeders also need to test the selected freezing tolerant plants in the field. For instance, different levels of carbohydrate accumulation in the alfalfa crown after artificial freezing and natural hardening were reported [29]. Artificial freezing tolerance was related to the accumulation of sucrose, stachyose, and raffinose and decreased levels of glucose, fructose, and starch. In contrast, alfalfa natural hardening triggered the accumulation of raffinose and stachyose and was less relevant to sucrose accumulation [29]. Perhaps, these physiological and molecular factors are behind the moderate relationship between indoor FT and field WH we have seen in the present study.
FT QTL, candidate gene and future direction
In this experiment, we found six favorable QTL (Table 2) that may have the potential to be used for MAS for alfalfa freezing tolerance as they individually explained more than 10 % of the phenotypic variance (R2 ≥ 10). Several other QTL with negative effects on freezing tolerance could be an interesting region to investigate the molecular basis of FT in alfalfa. Freezing tolerance in plants is regulated by a complex network of genes [30]. As an autotetraploid that still lacks complete homologs level reference genome, genomic studies of alfalfa are relatively complicated. Also, the species exhibits tetrasomic inheritance with a complicated segregating pattern so that including genome-wide marker information is difficult. Finding certain QTL using pseudo-testcross markers does not account for all loci governing the traits of interest. Because the crop is allogamous, developing other efficient QTL mapping populations such as recombinant inbred line (RIL) is impossible in alfalfa. Also, there is no established method to produce doubled haploid (DH) population in this autopolyploid species as in other species [31] which could be used to map the stable QTL. Therefore, any small information corresponding to the QTL and candidate gene for traits of interest in alfalfa is valuable in this genomic era.
Aligning M. truncatula CBF sequence and the presence of a freezing tolerance QTL (dft4) nearby on chromosome 6 indicated that more investigations are required in this candidate region. Past reports indicated that M. truncatula has a set of CBF genes on the long arm of chromosome six [32]. Expression analysis of CBF-related genes from M. trunctatula in alfalfa indicated that the genes (MsCBFl-17 and MsCBFl‐18) are potential functional homologs of CBF3 [33]. The CBF homologs and gene group were located not only on M. trucatula chromosome 6, but also on chromosome 5 [33, 34] on which we also detected several QTL associated with freezing sensitivity and a favorable QTL (dbr2) (Table 2). As we observed several freezing sensitivity-related QTL, the genomic regions may also harbor cold regulated (COR) genes that influence the expression of CBF in cold susceptible alfalfa.
Furthermore, the multiple QTL for FT and WH [17] with low to moderate R2 indicated that genomic selection (GS) could be a viable option to improve these traits. GS is becoming an effective method for the rapid selection of superior genotypes for cold hardiness improvement in different crops [35, 36]. Implementation of GS in forages and legumes for enhancing genetic gain through reduction of average cycle time and increase of selection accuracy has been perceived as a beneficial selection approach at present and for the future [37]. For instance, Poudel et al. [38] described GS as an effective approach to developing cold-tolerant cultivars of bioenergy crop switchgrass for northern latitudes. The potential application of GS in alfalfa has been described [39, 40].
Since the QTL identified in this study explained at least 10 % variance, integrating these QTL as fixed effect covariates in a GS model could be an effective approach to enhance alfalfa cold tolerance. However, the validation of QTL to multiple environments and diverse germplasms must be warranted before using them as covariates. Several past reports recommended that the inclusion of major QTL or genes in the GS models augmented the prediction accuracy of the model in different crop species [41,42,43,44]. Bernardo, R.(2013) reported if the percentage variance explained by the major gene is > 10 %, then using it as a fixed effect covariate improves prediction accuracy in genomewide selection. We also believe that using major cold tolerance QTL of alfalfa as a fixed effect in future GS studies would be effective for the better predictive ability of the model. As GS is based on whole-genome markers, utilizing QTL in the model most likely enables the reduction of the number of the required markers from the whole set. Further, the indoor phenotyping approach described here can be useful in phenotyping the training population designed for GS for alfalfa winter hardiness selection.
Conclusions
In this study, we reported an indoor approach for rapid screening of alfalfa freezing tolerance (FT) which is useful for accelerating the breeding for winter hardiness (WH) in the field. Since FT and WH are moderately correlated, we suggest the indoor selection of alfalfa germplasms before taking them to the field for better winter survival selection. We identified 20 QTL for FT-related traits in the population tested. The most favorable QTL were located in the proximity of chromosome six, where the crucial cold tolerance gene family (CBF) has been reported for the alfalfa closest relative M. truncatula. The validation of these QTL in various genetic backgrounds will be warranted before adopting them in MAS to ensure the loci are stable and repeatable across populations and environments. However, some of the favorable QTL that explained 10 % or more of the phenotypic variance could be tested directly in MAS. We suggest that genomic selection of alfalfa with the incorporation of validated QTL with major effects as covariates would be ideal to enhance a quantitative trait like freezing tolerance.
Methods
Plant materials
The plant materials used in this experiment include two alfalfa parent cultivars, their F1 progenies, and winter survival checks. The commercial certified seeds of alfalfa cultivar CW 1010 and 3010 were obtained from Alforex Seeds (Woodland, CA, USA) and BrettYoung (Winnipeg, Manitoba, Canada), respectively. The CW 1010 has the fall dormancy level ten (FD = 10) and the cultivar 3010 has FD level two (FD = 2). The seeds were collected in accordance with the national and internal guidelines. The winter survival of the cold-tolerant parent 3010 is two (WS = 2), whereas the WS rating of CW 1010 has not been defined (https://www.alfalfa.org/pdf/2021_Alfalfa_Variety_Leaflet.pdf). From field observations, CW 1010 has shown extensive damage in winter and has been considered as one of the winter susceptible alfalfa cultivars. More information about these varieties is found in NAFA variety ratings (https://www.alfalfa.org/pdf/2021_Alfalfa_Variety_Leaflet.pdf) and the details about the varieties can also be searched in the database (https://www.alfalfa.org/varietyratings.php). The check varieties were obtained from the National Plant Germplasm System (NPGS). We screened the alfalfa pseudo-testcross F1 [3010 (♀) x CW 1010 (♂)] population for freezing temperature response. The maternal parent ‘3010’ is a dormant type alfalfa cultivar with relatively higher winter survival whereas CW 1010 is non-dormant and cold-sensitive. The mapping population development and field experiment were described previously [17, 45, 46]. Briefly, hand pollination was performed to develop F1 progenies and the genotyping of F1 was performed with 3 SSR markers to confirm they were hybrid. The population was then grown in two locations, Blairsville and Watkinsville research farms of the UGA using three clonal replications in a randomized complete block design (RCBD). This study focused on freeze testing of alfalfa clones of the mapping population using a walk-in freezer (ESPEC North America, Inc.). Twenty clones per genotype were generated by stem-cuttings of 184 F1 progenies and parents. The clones were grown under normal growing conditions and management in the greenhouse. Prior to cold acclimation, twenty clones were divided into two sets, one for control and the other is the treatment group. Together with the experimental mapping population, we also grew the alfalfa winter survival (WS) check cultivars recommended by NAAIC to optimize the freezing test. The checks included the cultivars ZG 9830 (WS = 1), 5262 (WS = 2), WL325HQ (WS = 3), G-2852 (WS = 4), Archer (WS = 5), and Cuf 101 (WS = 6), where WS ‘1’ and ‘6’ indicated extremely winter-hardy and non-winter-hardy, respectively (https://www.naaic.org/stdtests/wintersurvivalnew.pdf).
Indoor phenotyping
For the check cultivars, we tested seeded plants while for the population, we tested vegetative clones. The check seeds were sown in 14 cm tall (Ray Leach, SC10) cone-tainers filled with farm soil and 5 cm depth of the Fafard germ mix (Fafard, MA) at the top of the cone. The Cecil sandy loam type farm soil falls under soil class fine, kaolinitic, thermic Typic Kanhapludults as described previously [47]. The seeded cones were placed in RL98 trays and the seedlings were grown in the greenhouse for 6–8 weeks. Then, the plants were transferred to an acclimation chamber at a temperature of 4 °C for 3 weeks. The chamber was adjusted to 8/16 (light/dark) hours period, and 70 % relative humidity (RH). The plants were watered weekly and fertilized with Hoagland’s nutrient solution once during the acclimation period. The plants in treatment and control sets were randomized so that both sets have uniform phenotypic distributions. We removed any cryptic clones that look phenotypically different than their sister clones. Various combinations of cold temperatures and times of exposure were tested to optimize the freezing trial until significant differences (chi-square test with P = 0.95) were observed between samples of the checks 5262 (WS = 2) and G-2852 (WS = 4), as described previously (https://www.naaic.org/stdtests/wintersurvivalnew.pdf). After the freezing test, the plants were moved to normal greenhouse conditions. The top portion of the plants in both the control and the treatment groups were then clipped leaving two nodes above the crown to allow regrowth. After two weeks from treatment, the data were recorded as survival percentage, regrowth height, and visual rating based on freezing tolerance on a scale of 1–5, with 1 being the most freezing tolerant and 5 being the most freezing sensitive. The criterion used for freezing tolerance rating had a slight modification in the bases used for winter survival rating (https://www.naaic.org/stdtests/wintersurvivalnew.pdf). We scored 1 for genotypes with no injury and uniform regrowth whereas 5 was given to heavily injured and barely survived genotypes. We also recorded the biomass of tested samples after three weeks of the freezing test. Four traits, visual rating based freezing tolerance (FT), percentage survival (PS), treatment vs. control regrowth ratio (RR), and biomass ratio (BR) were recorded.
Relationship between FT and WH
Phenotypic correlation between FT traits from indoor screening and WH scores from the field was computed using the PROC CORR procedure in SAS 9.4 (SAS Institute Inc.). In the 2016/2017 winter, Georgia experienced mild weather but the early spring frost that occurred in the first week of March caused severe damage in the new regrowth of the winter. Therefore, we compared the FT with WH field data obtained for the season 2016/2017 from both locations and combined environments (Table 1).
GBS and marker identification
GBS library preparation, Illumina sequencing, and data processing steps were clearly described previously [17]. In summary, alfalfa mapping population and parental samples DNA were extracted from the freeze-dried tissues with minor modification of the method described [48]. Then, two 96-plexed GBS libraries were constructed using ApeKI DNA digestion and following the method described in [49]. The libraries were sequenced at Georgia Genomics and Bioinformatics Core (GGBC) using Illumina NexSeq (150 Cycles) 75 PE High Output flow cell with four lanes. We processed the sequencing data using two different pipelines: Universal Network-Enabled Analysis Kit (UNEAK) [50] and GBS-SNP-CROP [51] for single nucleotide polymorphisms (SNP) identification. With the former pipeline, we only used the forward (R1) reads while with the latter we used both forward (R1) and reverse (R2) reads.
Genetic linkage and QTL mapping
The single nucleotide polymorphism (SNP) markers identified using GBS were filtered for missing (removed < 30 % missing) data. Then, we filtered again for single-dose allele (SDA) loci polymorphic (Aaaa x aaaa) to a unique parent as described [49]. The SDA SNPs segregating ratio 1:1 (AB:AA) was tested using chi-square test (α = 0.05). Since, the species exhibits tetrasomic inheritance, utilizing all markers with the available computational resources was not possible. Therefore, we only used markers that were segregating as in pseudo-testcross progenies and the strategy is called pseudo-testcross strategy. Then, we constructed 32 linkage groups for 8 chromosomes and each of four homologs separately for the maternal and paternal parent using regression mapping on JoinMap 5.0, where we used Kosambi mapping function and minimum independence LOD value 10 for marker grouping [17, 52]. The 32 linkage maps specific to the maternal parent retained 1837 SDA SNPs, whereas paternal linkage maps retained a total of 1377 SNPs. The average marker densities for linkage maps of each parental type were 1.5 cM/SNP. The chromosome of corresponding linkage groups was assigned based on the alignment of marker tag sequences on M. truncatula reference V4.1 [17]. We mapped the freezing tolerance-related traits on the linkage maps using Windows QTL Cartographer version 2.5. The QTL mapping was conducted with the composite interval mapping (CIM) method [53]. The LOD score specific to the trait was computed using 1000 permutations at a genome-wide threshold of P ≤ 0.05 [17]. The genotypic means of all four traits were used as trait values for QTL mapping.
Genomic analysis of candidate QTL
As an alfalfa genome has recently been published [24], we conducted sequence alignments of a cold-related gene C-repeat binding factor (CBF) of M. truncatula on alfalfa reference (Table 3), alfalfa sequence has not been cloned. The alignment allowed us to find CBF orthologs region on the alfalfa genome and relate it to the QTL we identified for cold tolerance. We also aligned tag sequences of markers under QTL regions, which most likely represent loci of CBF gene families, on alfalfa reference. However, the tag sequence was only around 64 bp in length (Supplementary File S1).
Developing breeding materials
The freezing tolerant genotypes we selected in the study were deemed as source germplasms for winter-hardy alfalfa cultivar development. To begin the breeding and selection process, we transplanted the freeze-tolerant F1 plants in the greenhouse and performed polycrossing among the full sibs using bee-mediated pollination. The sib-mated F2 seeds were bulk harvested and germinated in the greenhouse. The seedlings were then screened for freezing tolerant genotypes using a constant freezer environment. The survival half-sibs were then transplanted in bigger containers and intermated. Then the F2 derived half-sib progeny seeds were harvested separately for each parent and germinated. Then the seedlings of these freeze-tested parents were grown in Blairsville GA in spring 2019 for the evaluation of their field performance. We evaluated the survival rate of the half-sib progenies after 2019/2020 winter to assess the winter hardiness ability of the plants.
Availability of data and materials
The raw reads from genotyping-by-sequencing can be found at NCBI SRA under the accession number SRP150116 and with the link https://www.ncbi.nlm.nih.gov/sra/SRP150116. The GBS barcode key file required to demultiplex the SRA deposited fastq sequence files can be found at Dryad digital repository (https://doi.org/10.5061/dryad.1g1jwstwv).
Abbreviations
- BR:
-
Biomass ratio
- CBF :
-
C-repeat-binding factor
- Chr:
-
Chromosome
- FT:
-
Freezing tolerance
- FD :
-
Fall dormancy
- GBS:
-
Genotyping-by-sequencing
- MAS:
-
Marker-assisted selection
- PS:
-
Percentage survival
- QTL:
-
Quantitative trait loci
- RR:
-
Regrowth ratio
- SNP:
-
Single nucleotide polymorphisms
- WH:
-
Winter hardiness
- WS:
-
Winter survival
References
Leep R, Andresen J, Jeranyama P. Fall dormancy and snow depth effects on winterkill of alfalfa, vol 93. 2001.
Bélanger G, et al., Winter damage to perennial forage crops in eastern Canada: Causes, mitigation, and prediction, vol. 86. 2006.
Castonguay Y, et al. An indoor screening method for improvement of freezing tolerance in alfalfa. Crop Sci. 2009;49(3):809–18.
Lindstrom O, Dirr M. Acclimation and low-temperature tolerance of eight woody taxa. HortScience. 1989;24(5):818–20.
Castonguay Y, et al. Molecular physiology and breeding at the crossroads of cold hardiness improvement. Physiol Plant. 2013;147(1):64-74.
Adhikari L, Mohseni-Moghadam M, Missaoui A. Allelopathic effects of cereal rye on weed suppression and forage yield in Alfalfa. Am J Plant Sci. 2018;9(4):685–700.
Brouwer DJ, Duke SH, Osborn TC. Mapping Genetic Factors Associated with Winter Hardiness, Fall Growth, and Freezing Injury in Autotetraploid Alfalfa Research support provided by a Hatch grant from the College of Ag. and Life Sci., Univ. of Wisconsin-Madison. Crop Sci. 2000;40(5):1387–96.
Lindstrom OM. Transplant date influences cold hardiness of Leyland cypress following transplanting into the field. HortScience. 1992;27(3):217–9.
Peixoto MdM, Sage RF. Improved experimental protocols to evaluate cold tolerance thresholds in Miscanthus and switchgrass rhizomes. Gcb Bioenergy. 2016;8(2):257–68.
Mishra A, et al. Chlorophyll fluorescence emission as a reporter on cold tolerance in Arabidopsis thaliana accessions. Plant Signal Behav. 2011;6(2):301–10.
Castonguay Y, et al. Cold-Induced Biochemical and Molecular Changes in Alfalfa Populations Selectively Improved for Freezing Tolerance. Crop Sci. 2011;51(5):2132–44.
Adkins JA, Dirr MA, Lindstrom OM. Cold hardiness potential of ten Hydrangea taxa. J Environ Horticult. 2002;20(3):171–4.
Kimball JA, et al. Assessing freeze-tolerance in St. Augustinegrass: temperature response and evaluation methods. Euphytica. 2017;213(5):110.
Miura K, Furumoto T. Cold signaling and cold response in plants. Int J Mol Sci. 2013;14(3):5312–37.
Hincha DK, Zuther E. Plant Cold Acclimation. 2014. p. 6.
Miller AK, Galiba G, Dubcovsky J. A cluster of 11 CBF transcription factors is located at the frost tolerance locus Fr-Am2 in Triticum monococcum. Mol Genet Genomics. 2006;275(2):193–203.
Adhikari L, et al. Dissecting Key Adaptation Traits in the Polyploid Perennial Medicago sativa Using GBS-SNP Mapping. Front Plant Sci. 2018;9:934.
Paudel D, et al. Chap. 38 - Use of quantitative trait loci to develop stress tolerance in plants. In: Tripathi DK et al, editors. Plant life under changing environment. Academic Press; 2020. pp. 917–65.
Poudel HP, et al. Quantitative Trait Loci for Freezing Tolerance in a Lowland x Upland Switchgrass Population. Front Plant Sci. 2019;10:372.
Brown JM, et al. Identification of QTL associated with cold acclimation and freezing tolerance in Zoysia japonica. Crop Science. 2021;1-12.
Oakley CG, et al. QTL mapping of freezing tolerance: links to fitness and adaptive trade-offs. Mol Ecol. 2014;23(17):4304–15.
Avia K, et al. Genetic variability and QTL mapping of freezing tolerance and related traits in Medicago truncatula. Theor Appl Genet. 2013;126(9):2353–66.
Li X, et al. Mapping fall dormancy and winter injury in tetraploid alfalfa. Crop Sci. 2015;55(5):1995–2011.
Shen C, et al. The Chromosome-level genome sequence of the autotetraploid alfalfa and resequencing of core germplasms provide genomic resources for alfalfa research. Mol Plant. 2020;13(9):1250–61.
Kalberer SR, Wisniewski M, Arora R. Deacclimation and reacclimation of cold-hardy plants: Current understanding and emerging concepts. Plant Sci. 2006;171(1):3–16.
Pikaard CS, Mittelsten O, Scheid. Epigenetic regulation in plants. Cold Spring Harbor Perspect Biol. 2014;6(12):a019315.
Dubé M-P, et al. Characterization of two novel cold-inducible K3 dehydrin genes from alfalfa (Medicago sativa spp. sativa L.). Theor Appl Genet. 2013;126(3):823–35.
Jones FR. Winter Injury and Longevity in Unselected Clones from Four Wilt-Resistant Varieties of Alfalfa 1. Agron J. 1945;37(10):828–38.
Castonguay Y, et al. Differential accumulation of carbohydrates in alfalfa cultivars of contrasting winterhardiness. Crop Sci. 1995;35(2):509–16.
McKhann HI, et al. Natural variation in CBF gene sequence, gene expression and freezing tolerance in the Versailles core collection of Arabidopsis thaliana. BMC Plant Biol. 2008;8(1):105.
Filiault DL, et al. The Generation of Doubled Haploid Lines for QTL Mapping. Methods Mol Biol. 2017;1610:39–57.
Tayeh N, et al. A tandem array of CBF/DREB1 genes is located in a major freezing tolerance QTL region on Medicago truncatula chromosome 6. BMC Genom. 2013;14(1):814.
Kanchupati P, et al. The CBF-Like Gene Family in Alfalfa: Expression Analyses and Identification of Potential Functional Homologs of Arabidopsis CBF3. Crop Sci. 2017;57(4):2051–63.
Shu Y, et al. Transcriptome sequencing analysis of alfalfa reveals CBF genes potentially playing important roles in response to freezing stress. Genetics Mol Biol. 2017;40(4):824–33.
Michel S, et al. Improving and maintaining winter hardiness and frost tolerance in bread wheat by genomic selection. Front Plant Sci. 2019;10:1195.
Beil CT, et al. Genomic selection for winter survival ability among a diverse collection of facultative and winter wheat genotypes. Mol Breeding. 2019;39(2):29.
Simeão Resende RM, Casler MD, de Resende MDV. Genomic Selection in Forage Breeding: Accuracy and Methods. Crop Sci. 2014;54(1):143–56.
Poudel HP, et al. Genomic prediction for winter survival of lowland switchgrass in the Northern USA. G3 (Bethesda). 2019;9(6):1921–31.
Jia C, et al. Genomic Prediction for 25 Agronomic and Quality Traits in Alfalfa (Medicago sativa). Front Plant Sci. 2018;9:1220–0.
Biazzi E, et al. Genome-Wide Association Mapping and Genomic Selection for Alfalfa (Medicago sativa) Forage Quality Traits. PLoS One. 2017;12(1):e0169234.
Rice B, Lipka AE. Evaluation of RR-BLUP Genomic Selection Models that Incorporate Peak Genome-Wide Association Study Signals in Maize and Sorghum. Plant Genome. 2019;12(1):180052.
Bajgain P, Zhang X, Anderson JA. Genome-Wide Association Study of Yield Component Traits in Intermediate Wheatgrass and Implications in Genomic Selection and Breeding. G3 (Bethesda). 2019;9(8):2429–39.
Bernardo R. Genomewide selection when major genes are known. Crop Sci. 2014;54(1):68–75.
Zaïm M, et al., Combining QTL Analysis and Genomic Predictions for Four Durum Wheat Populations Under Drought Conditions. Front Genetics. 2020;11(316).
Adhikari L, Makaju SO, Missaoui AM. QTL mapping of flowering time and biomass yield in tetraploid alfalfa (Medicago sativa L.). BMC Plant Biol. 2019;19(1):359.
Adhikari L, Missaoui AM. Quantitative trait loci mapping of leaf rust resistance in tetraploid alfalfa. Physiol Mol Plant Pathol. 2019;106:238–45.
Adhikari L, Missaoui AM. Nodulation response to molybdenum supplementation in alfalfa and its correlation with root and shoot growth in low pH soil. J Plant Nutr. 2017;40(16):2290–302.
DOYLE J-D, Doyle J. JL 1987. A rapid DNA isolation procedure for small quantities of fresh leaf tissue. Phytochem Bull. 1987;19:1.
Li X, et al. A saturated genetic linkage map of autotetraploid alfalfa (Medicago sativa L.) developed using genotyping-by-sequencing is highly syntenous with the Medicago truncatula genome. G3 (Bethesda, Md). 2014;4(10):1971–9.
Lu F, et al. Switchgrass genomic diversity, ploidy, and evolution: novel insights from a network-based SNP discovery protocol. PLoS Genet. 2013;9(1):e1003215.
Melo AT, Bartaula R, Hale I. GBS-SNP-CROP: a reference-optional pipeline for SNP discovery and plant germplasm characterization using variable length, paired-end genotyping-by-sequencing data. BMC Bioinform. 2016;17(1):1–15.
Van Ooijen JW. JoinMap ® 5, Software for the calculation of genetic linkage maps in experimental population of diploid species. Wageningen: Kyazma B.V.; 2018.
Wang S, Basten C, Zeng Z. Windows QTL cartographer version 2.5. Statistical genetics. Raleigh: North Carolina State University; 2005.
Acknowledgements
We would like to thank Mr. Jonathan Markham for his assistance in this research with planting and field data collection. We also like to thank Ms. Kathryn Prado and Mrs. Muna Sharma for their assistance in clonal propagules preparation.
Funding
This work was supported by the USDA National Institute of Food and Agriculture, Hatch/Evans-Allen/McIntire Stennis project [1008718]. The fund was used for experimental setup and genotyping. Partial funding was provided by the UGA Cultivar Development and Research Program for indoor freeze screening and data generation. The funding was used for technical staff support of field screening.
Author information
Authors and Affiliations
Contributions
LA did phenotypic data collection, freezing test, sequencing data analysis, genotyping, and manuscript writing; SOM involved in phenotyping, clone preparation, and manuscript revision; OML assisted in protocol design and experiment accomplishment for freezing tolerance test; AMM designed the experiment, reviewed data analysis, and wrote the manuscript. All authors read and approved the submitted version of the article.
Corresponding author
Ethics declarations
Ethics approval and consent to participate
Not applicable.
Consent for publication
Not applicable.
Competing interests
The authors declare that they have no competing interests.
Additional information
Publisher’s Note
Springer Nature remains neutral with regard to jurisdictional claims in published maps and institutional affiliations.
Supplementary Information
Additional file 1: Supplementary File S1.
Tag sequences for flanking and peak markers identified within the QTL regions. Two variant alleles for each SNP were denoted as ‘query’ and ‘hit’.
Additional file 2: Supplementary File S2.
Fasta sequence of M. truncatula cold tolerance related gene dehydration-responsive element-binding protein 1C (also known as CBF5) obtained from the National Center for Biotechnology Information (NCBI).
Rights and permissions
Open Access This article is licensed under a Creative Commons Attribution 4.0 International License, which permits use, sharing, adaptation, distribution and reproduction in any medium or format, as long as you give appropriate credit to the original author(s) and the source, provide a link to the Creative Commons licence, and indicate if changes were made. The images or other third party material in this article are included in the article's Creative Commons licence, unless indicated otherwise in a credit line to the material. If material is not included in the article's Creative Commons licence and your intended use is not permitted by statutory regulation or exceeds the permitted use, you will need to obtain permission directly from the copyright holder. To view a copy of this licence, visit http://creativecommons.org/licenses/by/4.0/. The Creative Commons Public Domain Dedication waiver (http://creativecommons.org/publicdomain/zero/1.0/) applies to the data made available in this article, unless otherwise stated in a credit line to the data.
About this article

Cite this article
Adhikari, L., Makaju, S.O., Lindstrom, O.M. et al. Mapping freezing tolerance QTL in alfalfa: based on indoor phenotyping. BMC Plant Biol 21, 403 (2021). https://doi.org/10.1186/s12870-021-03182-4
Received:
Accepted:
Published:
DOI: https://doi.org/10.1186/s12870-021-03182-4