- Research
- Open access
- Published:
Genetic diversity structure of western-type carrots
BMC Plant Biology volume 21, Article number: 200 (2021)
Abstract
Background
Carrot is a crop with a wide range of phenotypic and molecular diversity. Within cultivated carrots, the western gene pool comprises types characterized by different storage root morphology. First western carrot cultivars originated from broad-based populations. It was followed by intercrosses among plants representing early open-pollinated cultivars, combined with mass phenotypic selection for traits of interest. Selective breeding improved root uniformity and led to the development of a range of cultivars differing in root shape and size. Based on the root shape and the market use of cultivars, a dozen of market types have been distinguished. Despite their apparent phenotypic variability, several studies have suggested that western cultivated carrot germplasm was genetically non-structured.
Results
Ninety-three DcS-ILP markers and 2354 SNP markers were used to evaluate the structure of genetic diversity in the collection of 78 western type open-pollinated carrot cultivars, each represented by five plants. The mean percentage of polymorphic loci segregating within a cultivar varied from 31.18 to 89.25% for DcS-ILP markers and from 45.11 to 91.29% for SNP markers, revealing high levels of intra-cultivar heterogeneity, in contrast to its apparent phenotypic stability. Average inbreeding coefficient for all cultivars was negative for both DcS-ILP and SNP, whereas the overall genetic differentiation across all market classes, as measured by FST, was comparable for both marker systems. For DcS-ILPs 90–92% of total genetic variation could be attributed to the differences within the inferred clusters, whereas for SNPs the values ranged between 91 to 93%. Discriminant Analysis of Principal Components enabled the separation of eight groups cultivars depending mostly on their market type affiliation. Three groups of cultivars, i.e. Amsterdam, Chantenay and Imperator, were characterized by high homogeneity regardless of the marker system used for genotyping.
Conclusions
Both marker systems used in the study enabled detection of substantial variation among carrot plants of different market types, therefore can be used in germplasm characterization and analysis of genome relationships. The presented results likely reveal the actual genetic diversity structure within the western carrot gene pool and point at possible discrepancies within the cultivars’ passport data.
Background
Cultivated carrot is a biennial root vegetable grown around the world in temperate and subtropical regions. It is an outcrossing diploid with a relatively small genome of ca. 473 Mb organized into 2n = 18 chromosomes [1]. Carrot is important nutritionally, placed among the most significant sources of β-carotene in the human diet. It is among the top ten vegetables in terms of global production [2]. Carrot is indigenous to Europe, Asia and North America, with Central Asia identified as the place of origin of cultivated carrots [3]. Carrot was most probably domesticated as a root crop around 1100 years ago in Central Asia. Early domesticated carrots were purple and yellow [4]. The majority of cultivated types that formed the basis of modern commercial cultivars were developed in Asia Minor (Turkey) and temperate regions of Europe. Thus, the above-mentioned regions are considered as the secondary centre of origin for carrot [5]. To date, several molecular approaches, such as isoenzymes, ALFPs, RFLPs and SNPs have been used to examine genetic relationships within D. carota [3, 6,7,8]. Population structure comprising four major groups has been commonly observed within D. carota species [3, 9,10,11]. European wild D. carota group is characterized by a high level of diversity and includes several D. carota subspecies; Asian wild group is less complex and comprises mostly D. carota subsp. carota. Western cultivated carrots form a numerous group characterized by high level of diversity in terms of storage root characteristics but are generally orange. Eastern cultivated carrots have more uniform root characteristics but display more variability in terms of colour, as they usually have yellow or purple roots. Further geographic structure was identified by Arbizu et al. [12], leading to the separation of an additional two groups: wild carrots of the Iberian Peninsula and Morocco (1) and landraces of the Balkan Peninsula, Middle East and North Africa (excluding Morocco) (2). Investigation of nearly 120 accessions representing Chinese cultivars and western cultivated carrot carried out by Ma et al. [13] showed clear separation of both gene pools and suggested independent processes of carotenoid-based root pigmentation in the history of eastern cultivars development.
Carrot is a crop with a wide range of phenotypic and genotyping variation that might be of use to breeders. Since the seventeenth century, a lot of breeding efforts have been focused on root traits such as shape, smoothness of the root surface or root integrity [14, 15]. First carrot cultivars originated from broad-based populations. It was followed by intercrosses among plants representing early open-pollinated (OP) varieties, combined with mass phenotypic selection for traits of interest. Discovery of cytoplasmic male sterility in the late 1940s led to a shift from OP to hybrid cultivars characterized by higher level of uniformity. Nonetheless, OP cultivars are still a valuable source of genetic diversity and represent a large portion of plant materials freely available to breeders worldwide through gene banks and public breeding programs [16].
Selective breeding improved root uniformity and led to the development of a range of cultivars differing in root shape and size. Based on the root shape and the market use of carrot cultivars, a dozen of market types (or varietal groups) have been distinguished [17] (Fig. 1). Some older market types were typically bred and developed in Europe (e.g. Long Orange, Amsterdam or Paris Market), while others were characteristic for the U.S. market (e.g. Imperator or Danvers). The work of Banga [14] has been the most comprehensive description of the main western cultivated carrot types available to date. He described key characteristics and use of modern types of western carotene carrot and discussed their connection with well-established original varieties. Despite apparent phenotypic variability observed among market classes, several studies have suggested that western cultivated carrot germplasm was genetically non-structured [3, 9, 10]. Later studies carried out by Stelmach et al. [18] provided the first molecular evidence for a possible root-type associated structure of genetic diversity in western cultivated carrot. They showed that Daucus carota Stowaway (DcSto) Miniature Inverted Repeat Transposable Element (MITE) based molecular markers (DcS-ILP) detected substantial variation among carrot plants of different origin and could be exploited in germplasm characterization and analysis of genome relationships. MITEs are non-autonomous DNA transposons requiring the presence of a related autonomous element to be a donor of a transposase inducing their transposition in trans. Global analysis of DcSto MITEs provided evidence for their recent mobility and identified a candidate autonomous element, DcMar1, as a possible source of transposase [19].
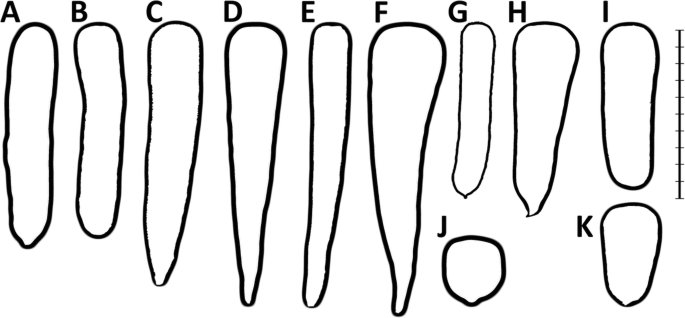
Typical shapes of carrot storage roots representing some of the most popular market types. A - Nantes, B - Berlikum, C - Autumn King (=Flakkee), D – Long Orange, E - Imperator, F – St. Valery, G - Amsterdam, H - Danvers, I - Chantenay, J – Paris Market, K - Guérande (=Oxheart). Bar length – 20 cm
In the present study, we investigated a collection of plants from a range of OP western-type carrot cultivars producing roots of different shapes and representing several varietal groups. We aimed to detect possible genetic structure underlying apparent phenotypic differences among well-established market types. We exploited and compared two codominant molecular marker systems, DcS-ILPs and SNPs, as we assumed that the former system might be capable of revealing variability which arose more recently, resulting from the transpositional activity of DcSto MITEs.
Results
Genetic diversity revealed by DcS-ILP and SNP genotyping
A total of 93 DcS-ILP markers and 2354 SNP markers, distributed along the nine carrot chromosomes (Additional file 1: Figure S1), were used to evaluate genetic diversity in the collection of 78 western type carrot cultivars. For DcS-ILP genotyping the number of alleles Na was 1.676 and the number of effective alleles Ne was 1.411, whereas for SNP genotyping the corresponding Na and Ne values were 1.783 and 1.512, respectively. The observed heterozygosity HO was higher for SNPs (0.323) than for DcS-ILPs (0.253), as well as the expected heterozygosity HE (0.295 for SNPs and 0.239 for DcS-ILPs). HE estimates of the cultivars ranged from 0.115 (LC1) to 0.323 (BE7) for DcS-ILPs and from 0.174 (LO1) to 0.350 (GU3) for SNPs. (Additional file 2: Table S1 and Additional file 3: Table S2). The mean percentage of polymorphic loci segregating within a cultivar varied from 31.18% (LC1) to 89.25% (BE7) for DcS-ILP markers and from 45.11% (LC1) to 91.29% (SV1) for SNP markers (Additional file 4: Table S3) revealing high levels of intra-cultivar heterogeneity, in contrast to their apparent phenotypic stability. Cultivars belonging to the Amsterdam market class were characterized by the lowest mean within-group HO (0.255 and 0.316 for DcS-ILP and SNP, respectively), whereas cultivars of the Imperator market class were characterized by the highest mean within-group HO (0.277 for DcS-ILPs and 0.329 for SNPs; Additional file 5: Table S4). The within-group genetic diversity (measured as HE) was generally lower than HO and ranged between 0.204 (Chantenay) and 0.267 (Berlikum) for DcS-ILP and between 0.269 (Chantenay) and 0.336 (St. Valery) for SNPs. Average inbreeding coefficient FIS for all cultivars was negative for both DcS-ILP (− 0.055) and SNP (− 0.097), again indicating high levels of intra-cultivar heterogeneity. The overall genetic differentiation across all market classes, as measured by FST, was comparable for both marker systems (0.294 for DcS-ILPs and 0.279 for SNPs; Table 1).
The FST analysis suggests a moderate level of differentiation between market classes. The strongest differentiation was observed between the cultivars belonging to the Amsterdam and St. Valery market classes (0.260 for DcS-ILP and 0.214 for SNPs; Additional file 5: Table S4). The within-group HO values were higher than the pairwise FST values, indicating that within-cultivar genetic variability had greater contribution to overall diversity than between-cultivar variability. Pairwise FST estimates computed for pairs of cultivars were comparable for both marker systems and ranged from 0.046 (IM3 vs. IM5) to 0.332 (LC1 vs. AM1) for DcS-ILP markers, and from 0.052 (NA2 vs. NA3) to 0.323 (LC1 vs. AM1) for SNPs (Additional file 6: Table S5 and Additional file 7: Table S6). The highest percent of pairwise-FST ranged between 0.1 and 0.15 (47.5% for DcS-ILP and 55.6% for SNPs; Fig. 2). AMOVA of both DcS-ILP and SNP genotyping data showed there was more genetic variation observed within the studied cultivars (71% for DcS-ILP and 68% for SNPs) than among them (29% for DcS-ILP and 32% for SNPs), further underlying the presence of significant amounts of heterogeneity within carrot OP cultivars.

Comparison of the distribution of estimated pairwise FST between the 78 studied OP carrot cultivars
Assessment of genetic structure using a model-based approach
The possible genetic structure within western cultivated carrots was inferred without any prior classification. The entire collection of 390 carrot plants was analyzed using an admixture model-based clustering (Fig. 3). ΔK values (Additional file 8: Table S7) suggested that the most likely number of clusters for DcS-ILP genotyping was three, four or seven, with K = 4 being the most probable (ΔK = 61.498), while for SNP genotyping it was three, four and five, with K = 3 being the most probable (ΔK = 133.541). Therefore, a more detailed assessment and comparison of the genetic structure was conducted for K ranging from three to five, and for K = 7.

Estimated genetic structure of the 390 carrot plants representing 78 cultivars. A – genetic structure inferred using 93 DcS-ILP markers for K = 3–5 and K = 7; B – genetic structure inferred using 2354 SNP markers for K = 3–5 and K = 7. Each plant is represented by vertical line divided into colored segments representing the membership fractions in the K clusters
In general, the genetic structure inferred from the SNP data was characterized by a greater number of cultivars assigned to the assumed clusters (member coefficient values (Q) ≥ 0.5) as compared to DcS-ILP data. The percentage of populations assigned was as followed: 98.7% for K = 3, 88.5% for K = 4, 78.2% for K = 5 and 74.4% for K = 7. For DcS-ILP data the percentage was generally 10 to 20 points lower and varied from 69.2% for K = 5 to 78.2% for K = 3. However, the number of cultivars attributed to clusters with high confidence (> 0.7) was higher for the DcS-ILP data set when K was larger than 3, as compared to the SNP data set (Table 2, Fig. 4).

Percentage of cultivars assigned to the assumed clusters. Assignment is based on different thresholds (Q ≥ 0.5 and Q ≥ 0.7) of the membership coefficients using SNP and DcS-ILP markers for the most probable numbers of K: K = 3–5 and K = 7. Q < 0.5 indicates a high level of admixture within a cultivar
SNP markers
For K = 3, the most probable number of clusters, clear separation of populations representing the Amsterdam and Baby Nantes market types was observed (group K1, Fig. 5). This pattern was noticeable regardless of the increasing number of the assumed clusters (up to K = 7). The average value of Q within K1 was very high (0.89; Table 3B). Only one cultivar of Amsterdam type (AM4) was characterized by high level of admixture, whereas cultivar AM5 was consequently grouped with cultivars belonging to the Nantes market type. The other clearly separated cluster (K3), that virtually did not change despite of increasing number of K, consisted of eight cultivars belonging to the Chantenay type. The average Q value within this group was high as well (0.78). Group K2 consisted of populations representing diverse market types, e.g. Autumn King (AU), Berlikum (BE) and Imperator (IM) characterized by long, stump roots; or Paris Market (PA), Guerande (GU), Danvers (DA) and Nantes (NA) typically of shorter (short to medium), thicker conical roots. The average distances between individuals within the assumed clusters (measured by HE) were highest for K2 (0.40), whereas for the clusters more homogeneous with respect to the origin of cultivars - K1 and K3, they were 0.31 and 0.30, respectively (Table 4B).

Estimated genetic structure of 78 carrot cultivars based on SNPs, inferred for K = 3–5 and K = 7. Two-letter abbreviations are used for indication of carrot market types: AM – Amsterdam, AU – Autumn King (Flakkee), BE – Berlikum, PA – Paris Market, IM – Imperator, NA – Nantes, DA – Danvers, GU – Guerande (Oxheart), CH – Chantenay, FO – fodder carrot. Three-letter abbreviations are corresponding to the cultivar symbols listed in Additional file 11: Table S10
Increasing the number of clusters to four resulted in the separation of K2 into two separate clusters: the new cluster K2 comprised of AU/BE/FO and cluster K4 comprised of PA/GU/DA/NA. When assuming five clusters, six cultivars belonging to the Nantes market type were separated from K4 creating cluster K5. When the number of clusters was increased to seven, five cultivars belonging to the Imperator type were clearly separated (K6) with Q values above 0.85. The seventh group (K7) consisted mostly of cultivars attributed to the Danvers and St. Valery market types. When K = 7, for four cultivars at least one the plants representing the cultivar was assigned to the different cluster than the majority, thus represented different gene pool. Within another eight cultivars at least one of the plants representing the cultivar was admixed (Q < 0.5) and therefore could not be assigned to any of the defined clusters.
DcS-ILP markers
When the presence of three clusters was assumed, two clusters (K1 and K2) grouped numerous populations of diverse origin such as Amsterdam, Berlikum, Autumn King in group K1 or Nantes, Imperator and St. Valery in group K2. Within K1 Amsterdam cultivars were characterized by high values of Q with mean of 0.85, whereas cultivars of other types were characterized by lower values of Q, not exceeding 0.77. The overall mean Q value within K1 was 0.74 (Table 3A). Eight out of ten analyzed cultivars of Chantenay market type were grouped with two cultivars of Guerande type and two cultivars of Paris Market type in one cluster K3 (Fig. 6). The mean Q for Chantenay cultivars within K3 was 0.89, whereas the overall mean Q for K3 was 0.79. When four clusters were assumed, the previous cluster K1 was reduced mainly to cultivars of the Amsterdam type, thus the mean Q value has increased to 0.85. Group K2 consistently comprised populations representing various root types such as Imperator, Autumn King and Paris Market with the mean Q value of 0.75. Group K3 was reduced to seven cultivars of Chantenay type and one belonging to Guerande market type and as such remained in spite of the increasing number of clusters (with mean Q = 0.87). For K = 4, newly separated group K4 consisted of 19 cultivars, nine of which belonged to the Nantes type (mean Q = 0.74). Increasing the assumed number of clusters to five resulted in separation of K5 (with mean Q = 0.75) from K2 group. K5 comprised of cultivars belonging to the Imperator and Paris Market types. For K = 5, K2 grouped seven cultivars belonging to the Autumn King market type, four populations of fodder carrot and single population of both Long Orange and St. Valery. The mean Q value for this cluster was 0.64. K4 was restricted exclusively to cultivars representing the Nantes type (mean Q = 0.74). When seven clusters were assumed, populations representing the Imperator type were grouped into K6 along with one population of fodder carrot (Q = 0.80). Group K7 was heterogeneous and comprised eleven cultivars of diverse market types. The mean Q value for that group was 0.77. For K = 7 17 cultivars were of mixed cluster assignment, whereas within another 22 cultivars at least one of the plants representing the cultivar was admixed (Q < 0.5) and therefore could not be assigned to any of the defined clusters. The average HE between individuals within the assumed clusters were highest for K2 (0.34), whereas for the clusters more homogeneous with respect to the origin of cultivars - K1 and K3, they were of lower values (0.28 and 0.24, respectively; Table 4A).

Estimated genetic structure of 78 carrot cultivars based on DcS-ILP markers, inferred for K = 3–5 and K = 7. Two-letter abbreviations are used for indication of carrot market types: AM – Amsterdam, AU – Autumn King (Flakkee), BE – Berlikum, PA – Paris Market, IM – Imperator, NA – Nantes, DA – Danvers, GU – Guerande (Oxheart), CH – Chantenay, FO – fodder carrot. Three-letter abbreviations are corresponding to cultivar symbols listed in Additional file 11: Table S10
For the most probable numbers of clusters, K = 3, K = 4 and K = 7 AMOVA analysis was carried out on both DcS-ILP and SNP genotyping data. In general, the majority of total genetic variation resulted from differences between cultivars assigned to the predefined clusters. For DcS-ILPs 90–92% of total genetic variation could be attributed to the differences within the clusters, whereas for SNPs the values ranged between 91 to 93%. For K = 3 and K = 4 the percentage of total variation resulting from differences between the assumed clusters was 7% for SNPs and 8% for DcS-ILPs. When the number of the predefined clusters was increased to seven, the percentage has risen to 9 and 10% for SNPs and DcS-ILPs, respectively.
Discriminant analysis of principal components
The analysis was carried out to provide an alternative non-model de novo grouping of the studied cultivars. The optimal number of groups (K) was found to be eight for both data sets resulting in comparable results of the classification of cultivars (Fig. 7). 65.39% assignment accuracy was observed on the cultivar level, i.e. 51 cultivars were attributed to the same groups 1–8. 277 of 390 plants were assigned to the same groups, resulting in 71.03% assignment accuracy at the plant level. Generally, DAPC enabled the separation of cultivars depending on their market type affiliation. Three groups of cultivars were characterized by high homogeneity regardless of the marker system used for genotyping: Amsterdam (group 1), Chantenay (group 3) and Imperator (group 6). Assignment accuracy on the cultivar level was 71% for group 6 and 100% for group 1 and group 3. Remaining groups were more heterogeneous with regard to classification of specific market types. For DcS-ILPs group 4 was the most numerous (Additional file 9: Table S8). Within this group Danvers, Paris Market and Guerande types prevailed. It comprised six cultivars of the Danvers type, four of the Paris Market type, four of the Guerande type together with two cultivars of the Nantes type NA1 and NA5), one of the Amsterdam type (AM5) and one cultivar of fodder carrot (FO2). The second most numerous group was comprised of seven cultivars of the Autumn King type, four cultivars of the Berlikum type and one cultivar of the fodder carrot (FO4). Group 7 was comprised of seven cultivars of the Nantes type. Group 8 comprised cultivars of the St. Valery type together with one Long Orange cultivar (LO1), three cultivars of the Autumn King type (AU1, AU7 and FL1), one cultivar of Berlikum type (BE5), one cultivar of Chantenay type (CH9) and one cultivar of fodder carrot (FO4). The least numerous group comprised only three cultivars, two of which were of the Paris Market type (PA1, PA8) and one of the Danvers type (DA6).

Discriminant analysis of principal components (DAPC) for 78 carrot cultivars. Analysis was carried out on DcS-ILP (a, b) and SNP (c, d) datasets. The axes represent Linear Discriminants (LD): 1st vs. 2nd (A, C) and 1st vs. 3rd (b, d). Each dot represents a cultivar. Two-letter abbreviations are used for indication of carrot market types prevailing in specific groups: AM – Amsterdam, AU – Autumn King (Flakkee), BE – Berlikum, PA – Paris Market, IM – Imperator, NA – Nantes, DA – Danvers, GU – Guerande (Oxheart), CH – Chantenay, FO – fodder carrot
For SNPs group 2 was the most numerous and comprised 19 cultivars of the Autumn King and Berlikum types together with fodder carrot (Additional file 10: Table S9). Thirteen cultivars of the Paris Market and Guerande types and one cultivar of the Chantenay type (CH9) were placed in group 5, whereas 8 cultivars of the Danvers type together with four cultivars, each of different type (BE5, CH6, NA8, FO2), were placed in group 4. Seven cultivars belonging to the Nantes type were grouped together with one cultivar of the Amsterdam type (AM5). Group 8 comprised only four cultivars: two of them of the St. Valery type, one of the Nantes type (NA6) and one of the Long Orange type (LO1).
Discussion
Previous studies carried out on diverse collections of wild and cultivated carrots suggested there was no distinctive genetic structure within neither wild nor cultivated (western and eastern) carrot [3, 8, 9, 11, 13, 16, 20]. Nonetheless, the above-mentioned studies were carried out on large sets of very diverse carrot germplasm. Because of the apparent and very distinctive genetic differences between wild and cultivated gene pools, they might not have been able to detect the structure of genetic diversity present within the group of western OP cultivars. Historically, the first of the market classes of the western cultivated carrot were selected in the eighteenth century from groups of cultivars showing similar storage root morphologies [21]. As such, the cultivars classified to one market class might have been of relatively close kin. However, as previously reported by Iorizzo et al. [1], no significant bottleneck was observed in the cultivated carrot, pointing at a possible continuous gene flow between the wild and the cultivated pools, and very likely also among different cultivars. Conventional selection based on the plant morphology, leading to the development of the existing types of carrot cultivars showing distinct morphological and agronomic characteristics, apparently allowed retention of significant amounts of genetic heterogeneity within OP cultivars.
The codominant DcS-ILP marker system exploited in the present study might reveal genetic variability which arose more recently as DcSto MITEs show extreme insertional polymorphism within the carrot genome [19, 22]. Possibly, their recent mobilisation could have led to the genetic diversification within the western carrot gene pool. Despite many advantages, high throughput molecular marker systems, such as SNPs or DArTs are not able to detect transposable element (TE) insertion-derived variability. The resolving power of the DcS-ILP panel was previously demonstrated on the collection of 23 OP cultivars of western type carrot [18]. The panel of high quality SNPs bears advantages of cost-efficient throughput sequencing-derived markers but is reduced to ca. 2300 loci evenly-distributed across the genome and referred to the high-quality genome assembly [1], thus providing time- and computing efficiency when exploited for the evaluation of genetic structure within the larger datasets. Both panels of markers can easily be extended by additional loci to gain extra biological information or to possibly modify the resolution of population structure.
The results of the AMOVA, together with high values of HO, on both cultivar and market class level indicated a significantly higher level of intra-cultivar genetic diversity, mainly contributing to the overall genetic diversity observed in the investigated collection of cultivars. This observation is in accordance with previous studies of Maksylewicz and Baranski [10], as they indicated that almost two third of the of total variation observed in highly diverse collection of carrot cultivars and landraces was attributed to intra-population variation. The values of inbreeding coefficients in the collections of both advanced cultivars and landraces in the studies carried out by Baranski et al. [9] and Maksylewicz and Baranski [10] indicated the excess of homozygous loci that could suggest the repeated selfing during breeding programs aimed at the production of uniform, advanced cultivars. However, using a much more robust set of polymorphisms we did not observe positive inbreeding coefficients in our collection of OP cultivars.
Cultivars classified as Chantenay, Amsterdam and Paris Market types showed lower gene diversity (measured as HE) among the 11 predefined market classes, whereas cultivars classified to the Berlikum, St. Valery and Imperator types were among the most heterogenous. STRUCTURE clustering led to the decrease in the most probable number of groups from 11 predefined market classes to the most probable three to five or seven clusters. Non-model DAPC grouping also indicated the lesser number of relatively homogenous groups in the examined collection of cultivars. The choice of the most probable number of clusters was more ambiguous for DcS-ILP markers as the differences in the ΔK value were relatively small, but generally the increase of the number of defined clusters resulted in lower fraction of the unassigned cultivars together with the increase of the average membership coefficient (Q) within the clusters. This tendency was reversed in the case of SNP genotyping data. The more clusters were extracted, the lower mean values of Q within the groups were observed. Nonetheless, most of the cultivars belonging to the Amsterdam and Chantenay types were always clearly separated from other varieties and characterized by the highest values of within-group Q together with the lowest within-group HE. According to the classification of carrot market types proposed by Banga [14] both the Amsterdam and the Chantenay types represent the ‘Horn’ group that comprises a vast selection of high-quality carrot cultivars subdivided to at least eight market classes (Fig. 8). The Amsterdam market type refers to forcing carrot cultivars grown under covers or for early production in the open. The use of Amsterdam cultivars was originally limited to an early production under covers. Breeders were seeking plant material characterised by a high yield and considerable length, together with the vigour being the key feature in forcing varieties. In the nineteenth century only few varieties could meet the expectations, with Utrecht Forcing among them. The modern Amsterdam OP cultivars are believed to be direct descendants of the Utrecht Forcing [14].

Schematic representation of the origin of main types of Western carrot as proposed by Banga [14]. Solid arrows show direction of the development of new cultivar types. Punctuated arrows indicate possible origin of the particular type. Underlined names indicate the types of cultivars investigated in the present study. Colours of the boxes represent particular market types or groups of market types clustered using DAPC method for both DcS-ILP and SNP data (see Fig. 7)
To date, there is no evidence pointing out that any other breeding material was used to develop Amsterdam cultivars. It is in accordance with our results of STRUCTURE and DAPC clustering, indicating a relatively strong distinctiveness of Amsterdam carrots from other market types, possibly allowing preservation of its specific agricultural characteristics. The admixed nature of Amsterdamska cv. possibly reflects the use of Nantes breeding material in the course of the cultivar development. The Chantenay market type comprises cultivars developed for the production between half-summer and late winter carrots. This type is considered as a deviation from main types representing ‘Late Half Long Horn’ group of market types and was developed as a parallel selection to Guerande type and are believed to originate from la race de Hollande cv [14].. However, the majority of Chantenay cultivars was grouped in one clearly distinctive cluster with very high membership values. Regardless of the molecular marker genotyping system, two cultivars, i.e. Chantenay Long Type and Criolla, were characterized by high levels of admixture. Interestingly, in both cultivars the major genetic components were derived from the market classes with shared ancestor according to the classification proposed by Banga [14]. The two major genetic components of Chantenay Long Type cultivar pointed towards the cross between breeding materials belonging to the Danvers and Imperator types. Since Chantenay Long Type originated in the U.S., the breeding material of Danvers type could be introduced in the course of the cultivar development, especially because this market type originated in the U.S. in 1870s, and is still used for bunching [14]. The relatively high proportion of genetic components originating from Imperator might be the effect of the crosses between Chantenay and Imperator aimed at obtaining longer storage root. Similarly, the reason for clustering of Criolla cultivar (originally classified as Chantenay) with cultivars of the Danvers type could be in the use of the most easily accessible parental breeding material originating from North America. It highlights possible discrepancies between the passport data attributing a cultivar to a particular market class relative to its phenotype and its actual pedigree. Ma et al. [13] reported that Chinese orange carrots, sharing many morphological characteristics with western orange carrots, clustered with Chinese red carrots, suggesting that Chinese orange cultivars and landraces could have emerged from original Asian carrot varieties. It shows that similar phenotypic traits can result from selection from different gene pools. Thus, the presented results possibly reveal the actual genetic diversity within the western carrot gene pool, coupled with remarkable intra-cultivar heterogeneity and significant levels of admixture.
Conclusions
The aim of the current study was to detect possible genetic structure underlying phenotypic differences among market types of western carrot. We exploited two molecular marker systems, SNPs and TE insertion-derived DcS-ILPs, to provide the tool for time- and cost-efficient evaluation of larger datasets. Both marker systems enabled detection of substantial variation among carrot plants of different market types, therefore can be used in germplasm characterization and analysis of genome relationships. Both model-based STRUCTURE clustering and non-model DAPC grouping indicated the reduction in the number of relatively homogenous groups of OP cultivars in comparison with the classification based primarily on phenotypic traits. The presented results likely reveal the actual genetic diversity within the western carrot gene pool and point at possible discrepancies within the cultivars’ passport data.
Methods
Plant material and DNA extraction
Carrot open-pollinated cultivars used in this study were obtained from the Warwick Genetic Resource Unit (WGRU) (Additional file 11: Table S10). A total of 390 plants representing 78 OP western-type carrot cultivars (five plants per cultivar) of various tap root shape and market types were grown in the field in Gołębiew (Poland), in 2014 and 2016, under standard agricultural practice, optimally irrigated, fertilized and protected from pathogens. DNA was isolated from fresh young leaves using a modified CTAB protocol (Briard et al., 2000).
DcS-ILP genotyping and SNP discovery by GBS
Genotyping with the use of 93 DcS-ILP markers (Additional file 12: Table S11) was performed as described by Stelmach et al. [18]. The DcS- ILP marker profiles were scored manually. Each allele was scored as: 1 (empty insertion site), 2 (occupied insertion site) or 0 (lack of amplification). The codominant marker matrix with diploid individuals was created (Additional file 13: Table S12). For SNP discovery plants were genotyped using genotyping-by-sequencing (GBS) at the University of Wisconsin-Madison Biotech Center, carried out as described by Ellison et al. [23]. SNPs were called using Tassel 5.2.31 [24, 25] and the reference carrot genome LNRQ00000000.1 [1]. Polymorphisms were filtered using the VCFtools [26]. Only high quality SNPs (parameters: --max-alleles 2 --max-missing-count 95 --maf 0.1 --minDP 8) were retained and the resulting vcf file was subsequently recoded to the STRUCTURE format matrix using plink 1.9 software [27] (Additional file 14: Table S1).
Data analysis
Genetic diversity indices such as: number of alleles (Na), number of effective alleles (Ne), observed heterozygosity (HO) and expected heterozygosity (HE) were calculated for both DcS-ILP and SNP codominant marker systems using GenAlEx 6.51 [28]. Pairwise FST was estimated using FinePop2 R package [29]. Genetic diversity structure was investigated with STRUCTURE 2.3 [30]. Bayesian clustering was carried out on both DcS-ILP and SNP genotyping data matrices. The length of the burn-in period was set to 100,000 and the number of Markov Chain Monte Carlo (MCMC) replications after the burn-in were assigned at 500,000 for each number of clusters (K) set from 2 to 11 (the number of the predefined market classes). Five independent iterations with an admixture and correlated allele frequencies model were performed for each simulated value of K. no prior knowledge about the origin of the analyzed populations was used. The most informative K was identified using ΔK value as described by Evanno et al. [31]. To evaluate differentiation among the most probable number of subpopulations, Nei’s genetic distances and pairwise FST estimations were calculated in GenAlEx 6.51. Analysis of molecular variance (AMOVA) was also carried out on codominant genotyping distance matrices in GenAlEx 6.51 with 999 permutations. To provide an assessment of genetic diversity of the studied collection without prior assumptions on the population structure, we conducted Principal Component Analysis (PCA) followed by Discriminant Analysis of Principal Components (DAPC) using adegenet 2.1.1 R package [32]. Analyses were carried out on both DcS-ILP and SNP datasets. In DAPC, the optimal numbers of retained principal components were determined using a cross-validation (xval function implemented in adegenet). 150 and 60 principal components explaining 76% (SNP) and 89% (DcS-ILP) of the total variance were retained for the DAPC analysis of SNP and DcS-ILP datasets, respectively. The number of groups was determined de novo using find.clusters() function implemented in adegenet. The optimal K was selected based on the decreasing values of Bayesian Information Criterion (BIC). Individuals were then assigned to the clusters.
Availability of data and materials
The datasets supporting the conclusions of this article are included within the article and its additional files or are available from the corresponding author on reasonable request.
References
Iorizzo M, Ellison S, Senalik D, Zeng P, Satapoomin P, Huang J, et al. A high-quality carrot genome assembly provides new insights into carotenoid accumulation and asterid genome evolution. Nat Genet. 2016;48(6):657–66. https://doi.org/10.1038/ng.3565.
Simon PW. Economic and academic importance. In: Simon P, Iorizzo M, Grzebelus D, Baranski R, editors. The Carrot Genome. C. Cole, series editor. Compendium of Plant Genomes. Springer Nature Switzerland AG; 2019. p. 1–8.
Iorizzo M, Senalik DA, Ellison SL, Grzebelus D, Cavagnaro PF, Allender C, et al. Genetic structure and domestication of carrot (Daucus carota subsp. sativus) (Apiaceae). Am J Bot. 2013;100(5):930–8. https://doi.org/10.3732/ajb.1300055.
Stolarczyk J, Janick J. Carrot: history and iconography. Chron Horticult. 2011;51:13–8.
Banga O. Origin and distribution of the Western cultivated carrot. Genet Agrar. 1963;17:357–70.
Vivek BS, Simon PW. Linkage relationships among molecular markers and storage root traits of carrot (Daucus carota L. ssp. sativus). Theor Appl Genet. 1999;99(1-2):58–64. https://doi.org/10.1007/s001220051208.
Shim SI, Jørgensen RB. Genetic structure in cultivated and wild carrots (Daucus carota L.) revealed by AFLP analysis. Theor Appl Genet. 2000;101:227–33.
Bradeen JM, Bach IC, Briard M, le Clerc V, Grzebelus D, Senalik DA, et al. Molecular Diversity Analysis of Cultivated Carrot (Daucus carota L.) and Wild Daucus Populations Reveals a Genetically Nonstructured Composition. J Amer Soc Hort Sci. 2002;127:383–91.
Baranski R, Maksylewicz-Kaul A, Nothnagel T, Cavagnaro PF, Simon PW, Grzebelus D. Genetic diversity of carrot (Daucus carota L.) cultivars revealed by analysis of SSR loci. Genetic Resources Crop Evolution. 2012;59:163–70.
Maksylewicz A, Baranski R. Intra-population genetic diversity of cultivated carrot (Daucus carota L.) assessed by analysis of microsatellite markers. Acta Biochim Pol. 2013;60:753–60.
Grzebelus D, Iorizzo M, Senalik D, Ellison S, Cavagnaro P, Macko-Podgorni A, et al. Diversity, genetic mapping, and signatures of domestication in the carrot (Daucus carota L.) genome, as revealed by diversity arrays technology (DArT) markers. Mol Breed. 2014;33(3):625–37. https://doi.org/10.1007/s11032-013-9979-9.
Arbizu CI, Ellison SL, Spooner DM, Senalik D, Simon PW. Genotyping-by-sequencing provides the discriminating power to investigate the subspecies of Daucus carota (Apiaceae). BMC Evol Biol. 2016;16(1):234. https://doi.org/10.1186/s12862-016-0806-x.
Ma ZG, Kong XP, Liu LJ, Ou CG, Sun TT, Zhao ZW, et al. The unique origin of orange carrot cultivars in China. Euphytica. 2016;212(1):37–49. https://doi.org/10.1007/s10681-016-1753-8.
Banga O. Main types of the western carotene carrot and their origin. Zwolle: N.V. Uitgevers-Maatschappij W.E.J. Tjeenk Willink; 1963.
Simon PW, Freeman R, Vieira J, Boiteux LS, Nothnagel T, Michalik B, et al. Carrot. In: Prohens J, Nuez F, editors. Vegetables: Fabaceae, Liliaceae, Solanaceae, and Umbelliferae. New York: Springer New York; 2008. p. 327–57. https://doi.org/10.1007/978-0-387-74110-9_8.
Luby CH, Goldman IL. Improving freedom to operate in carrot breeding through the development of eight open source composite populations of carrot (Daucus carota L. var. sativus). Sustain. 2016;8:479.
Rubatzky VE, Quiros CF, Simon PW. Carrots and related vegetable Umbelliferae. New York: CAB International, Wallingford; 1999.
Stelmach K, Macko-Podgórni A, Machaj G, Grzebelus D. Miniature Inverted Repeat Transposable Element Insertions Provide a Source of Intron Length Polymorphism Markers in the Carrot (Daucus carota L.). Front Plant Sci. 2017;8:725.
Macko-Podgórni A, Stelmach K, Kwolek K, Grzebelus D. Stowaway miniature inverted repeat transposable elements are important agents driving recent genomic diversity in wild and cultivated carrot. Mob DNA. 2019;10(1):47. https://doi.org/10.1186/s13100-019-0190-3.
Arbizu C, Ruess H, Senalik D, Simon PW, Spooner DM. Phylogenomics of the carrot genus (Daucus, Apiaceae). Am J Bot. 2014;101:1–20.
Banga O. The development of the original European carrot material. Euphytica. 1957;6:64–76.
Macko-Podgorni A, Nowicka A, Grzebelus E, Simon PW, Grzebelus D. DcSto: carrot stowaway-like elements are abundant, diverse, and polymorphic. Genetica. 2013;141(4-6):255–67. https://doi.org/10.1007/s10709-013-9725-6.
Ellison SL, Luby CH, Corak KE, Coe KM, Senalik D, Iorizzo M, et al. Carotenoid presence is associated with the or gene in domesticated carrot. Genetics. 2018;210(4):1497–508. https://doi.org/10.1534/genetics.118.301299.
Bradbury PJ, Zhang Z, Kroon DE, Casstevens TM, Ramdoss Y, Buckler ES. TASSEL: software for association mapping of complex traits in diverse samples. Bioinformatics. 2007;23(19):2633–5. https://doi.org/10.1093/bioinformatics/btm308.
Glaubitz JC, Casstevens TM, Lu F, Harriman J, Elshire RJ, Sun Q, et al. TASSEL-GBS: a high capacity genotyping by sequencing analysis pipeline. PLoS One. 2014;9(2):e90346. https://doi.org/10.1371/journal.pone.0090346.
Danecek P, Auton A, Abecasis G, Albers C, Banks E, DePristo M, et al. The variant call format and VCFtools. Bioinformatics. 2011;27(15):2156–8. https://doi.org/10.1093/bioinformatics/btr330.
Purcell S, Neale B, Todd-Brown K, Thomas L, Ferreira MAR, Bender D, et al. PLINK: a tool set for whole-genome association and population-based linkage analyses. Am J Hum Genet. 2007;81(3):559–75. https://doi.org/10.1086/519795.
Smouse PE, Banks SC, Peakall R. Converting quadratic entropy to diversity: both animals and alleles are diverse, but some are more diverse than others. PLoS One. 2017;12(10):e0185499. https://doi.org/10.1371/journal.pone.0185499.
Nakamichi R, Kishino H, Kitada S. FinePop: Fine-Scale Population Analysis. 2020. https://cran.r-project.org/web/packages/FinePop. Accessed 27 Dec 2020.
Pritchard JK, Wen X, Falush D. Structure software: version 2.2.3. Univ Chicago, Chicago; 2008.
Evanno G, Regnaut S, Goudet J. Detecting the number of clusters of individuals using the software STRUCTURE: a simulation study. Mol Ecol. 2005;14(8):2611–20. https://doi.org/10.1111/j.1365-294X.2005.02553.x.
Jombart T. Adegenet: a R package for the multivariate analysis of genetic markers. Bioinformatics. 2008;24(11):1403–5. https://doi.org/10.1093/bioinformatics/btn129.
Acknowledgements
Not applicable.
Funding
The research was financed from funds for basic research on biological progress in agriculture for years 2014–2020 granted by the Polish Ministry of Agriculture and Rural Development; KS was supported by the Polish National Science Centre (Narodowe Centrum Nauki), programme ETIUDA 7, project no. 2019/32/T/NZ9/00198.
Author information
Authors and Affiliations
Contributions
KS and DG designed the study; KS prepared plant material and preformed DcS-ILP genotyping; AM-P and KS performed in silico analysis of GBS data; KS performed the assessment of genetic diversity; KS, DG and CA wrote the manuscript. All authors read, reviewed, and approved the final manuscript.
Corresponding author
Ethics declarations
Ethics approval and consent to participate
Not applicable.
Consent for publication
Not applicable.
Competing interests
The authors declare that they have no competing interests.
Additional information
Publisher’s Note
Springer Nature remains neutral with regard to jurisdictional claims in published maps and institutional affiliations.
Supplementary Information
Additional file 1: Figure S1.
Genomic distribution of SNP and DcS-ILP markers on nine chromosomes of the carrot genome; Legend: The black vertical bars correspond to the position of SNP and DcS-ILP markers; the names of DcS-ILPs are bold maroon.
Additional file 2: Table S1.
DcS-ILP panel summary statistics for the analysed collection of carrot cultivars.
Additional file 3: Table S2.
SNP panel summary statistics for the analysed collection of carrot cultivars.
Additional file 4: Table S3.
Comparison of the percentage of polymorphic loci observed within analysed cultivars.
Additional file 5: Table S4.
Mean HO and HE estimates and pairwise FST values obtained for the predefined market classes.
Additional file 6: Table S5.
Pairwise cultivar estimates of FST based on 93 DcS-ILP markers.
Additional file 7: Table S6.
Pairwise cultivar estimates of FST based on 2354 SNP markers.
Additional file 8: Table S7.
Estimation of the optimum number of clusters based on Evanno’s ∆K method.
Additional file 9: Table S8.
Results of DAPC grouping carried out on DcS-ILP genotyping data.
Additional file 10: Table S9.
Results of DAPC grouping carried out on SNP genotyping data.
Additional file 11: Table S10.
Characteristics of the 78 carrot cultivars used in the study.
Additional file 12: Table S11.
Description of 93 DcS-ILP markers used for genotyping the collection of 78 OP carrot cultivars.
Additional file 13: Table S12.
The codominant DcS-ILP marker matrix obtained for the collection of 390 carrot plants.
Additional file 14: Table S13.
The codominant SNP marker matrix obtained for the collection of 390 carrot plants.
Rights and permissions
Open Access This article is licensed under a Creative Commons Attribution 4.0 International License, which permits use, sharing, adaptation, distribution and reproduction in any medium or format, as long as you give appropriate credit to the original author(s) and the source, provide a link to the Creative Commons licence, and indicate if changes were made. The images or other third party material in this article are included in the article's Creative Commons licence, unless indicated otherwise in a credit line to the material. If material is not included in the article's Creative Commons licence and your intended use is not permitted by statutory regulation or exceeds the permitted use, you will need to obtain permission directly from the copyright holder. To view a copy of this licence, visit http://creativecommons.org/licenses/by/4.0/. The Creative Commons Public Domain Dedication waiver (http://creativecommons.org/publicdomain/zero/1.0/) applies to the data made available in this article, unless otherwise stated in a credit line to the data.
About this article

Cite this article
Stelmach, K., Macko-Podgórni, A., Allender, C. et al. Genetic diversity structure of western-type carrots. BMC Plant Biol 21, 200 (2021). https://doi.org/10.1186/s12870-021-02980-0
Received:
Accepted:
Published:
DOI: https://doi.org/10.1186/s12870-021-02980-0