- Research article
- Open access
- Published:
Temporal expression patterns of fruit-specific α- EXPANSINS during cell expansion in bell pepper (Capsicum annuum L.)
BMC Plant Biology volume 20, Article number: 241 (2020)
Abstract
Background
Expansins (EXPs) facilitate non-enzymatic cell wall loosening during several phases of plant growth and development including fruit growth, internode expansion, pollen tube growth, leaf and root development, and during abiotic stress responses. In this study, the spatial and temporal expression patterns of C. annuum α- EXPANSIN (CaEXPA) genes were characterized. Additionally, fruit-specific CaEXPA expression was correlated with the rate of cell expansion during bell pepper fruit development.
Results
Spatial expression patterns revealed that CaEXPA13 was up-regulated in vegetative tissues and flowers, with the most abundant expression in mature leaves. Expression of CaEXPA4 was associated with stems and roots. CaEXPA3 was expressed abundantly in flower at anthesis suggesting a role for CaEXPA3 in flower development. Temporal expression analysis revealed that 9 out of the 21 genes were highly expressed during fruit development. Of these, expression of six genes, CaEXPA5, CaEXPA7, CaEXPA12, CaEXPA14 CaEXPA17 and CaEXPA19 were abundant 7 to 21 days after anthesis (DAA), whereas CaEXPA6 was strongly expressed between 14 and 28 DAA. Further, this study revealed that fruit growth and cell expansion occur throughout bell pepper development until ripening, with highest rates of fruit growth and cell expansion occurring between 7 and 14 DAA. The expression of CaEXPA14 and CaEXPA19 positively correlated with the rate of cell expansion, suggesting their role in post-mitotic cell expansion-mediated growth of the bell pepper fruit. In this study, a ripening specific EXP transcript, CaEXPA9 was identified, suggesting its role in cell wall disassembly during ripening.
Conclusions
This is the first genome-wide study of CaEXPA expression during fruit growth and development. Identification of fruit-specific EXPAs suggest their importance in facilitating cell expansion during growth and cell wall loosening during ripening in bell pepper. These EXPA genes could be important targets for future manipulation of fruit size and ripening characteristics.
Background
Expansins are proteins that mediate cell wall loosening during cell enlargement mediated growth in plants [1, 2]. Additionally they are involved in cell wall modification during fruit softening, root growth, pollen tube growth and in abiotic stress responses [2,3,4,5,6,7]. Expansins belong to a large superfamily of genes which are mainly divided into four families based on sequence analysis; α- EXPANSIN (EXPA), β- EXPANSIN (EXPB), EXPANSIN A-like (EXPLA) and EXPANSIN B-like (EXPLB) [8, 9]. Of these, EXPA constitutes the largest family with well-documented roles in cell wall expansion [10] (Table 1). The EXPB family members also demonstrate cell wall loosening activity and this family includes group 1 grass pollen allergens which facilitate pollen tube invasion [9, 20, 21]. EXLA and EXLB proteins belong to smaller families and their biological function is not clearly understood [9].
EXPAs have been indicated to play a role in hypocotyl extension in cucumber [22, 23] and leaf initiation in tomato [24]. Expression of both EXPAs and EXPBs was associated with internode elongation in deep-water rice [20, 25, 26]. Certain members of the EXPA family regulate the initiation and elongation of root hairs in Arabidopsis, rice and soybean [5, 27, 28]. The expression of EXPA genes during fruit development suggests a role in fruit expansion and ripening in several fruit crops such as tomato, pear and peach [3, 4, 12, 29,30,31].
EXPAs typically consists of 250–275 amino acids and mainly contains three domains: an N-terminal 20–30 amino acid signal peptide; Domain 1, made of the double-psi beta-barrel (DPBB) domain which is structurally similar to the glycosyl hydrolase family 45 (GH45); and Domain 2, which has a β-sandwich fold and is categorized as the carbohydrate binding module family 63 (CBM63) [9, 21]. In spite of the similarity to GH45 enzymes, EXPs do not exhibit hydrolytic activity. In fact, EXPA mediates non-enzymatic cell wall loosening in a pH dependent manner to enable cell expansion [10, 32]. Although the precise mechanism of action is not fully elucidated, EXPs are involved in disrupting noncovalent bonds between cellulose microfibrils and xyloglucan [9, 10].
Fruit development, in many species including pepper (C. annuum), can be mainly divided into four phases: fruit set, cell division, cell expansion and ripening [33]. Among these, fruit growth primarily occurs during the cell division and cell expansion phases, with the vast majority of growth occurring during the latter phase. In tomato, post-mitotic cell expansion results in an overall increase in cell volume by over 30,000 fold [34]. In pepper, however, nearly all cell division occurs pre-anthesis and only post-mitotic cell expansion is noted post-anthesis [35, 36]. The potential roles of specific EXPs in regulating post-mitotic cell expansion and fruit growth in bell pepper have not been evaluated.
In this study, EXPs were identified from bell pepper and spatial expression patterns of CaEXPA transcripts in seedlings, root, stem, leaves and fruit were determined. In addition, temporal expression patterns of CaEXPA transcripts were determined during fruit growth and development. Finally, patterns of CaEXPA transcript abundance were associated with changes in the relative rate of cell expansion during fruit growth and development. This is the first genome-wide identification of EXP genes during fruit expansion and ripening in bell pepper.
Results
Characterization of CaEXP gene family
A total of 40 CaEXP genes were identified from the C. annuum cv. Zunla-1 genome and sequences were retrieved from NCBI database [37] (Table 2). The length of the predicted protein sequences ranged from 239 to 298 amino acids (Table 2). Each EXP family has a characteristic sequence of conserved cysteine and tryptophan residues, and EXPA and EXPB also contain the conserved HFD motif [21]. Based on the conserved amino acids characteristic of a particular EXP family, 21 CaEXPA, 7 CaEXPB, 1 CaEXLA and 9 CaEXLB genes were identified (Table 2; Additional Fig. 1). All the conserved amino acids previously identified and described were present in CaEXPs with a few exceptions [21]. The characteristic HFD motif in EXPA and EXPB families was HFV in case of CaEXPA5 and CaEXPA10 and HLV in case of CaEXPB3 (Additional Fig. 1). While majority of the tryptophan residues were conserved in CaEXPA, they were not completely conserved in CaEXPB (Additional Fig. 1). Next, phylogenetic analysis was performed, which indicated that members were more closely related within families than between families (Fig. 1A). All the three domains, an N-terminal signal peptide domain, the double-psi beta-barrel (DPBB) domain and the CBM63 domain (homologous to group-2 pollen allergens in grass) were present in all the CaEXPs with the exception that the signal peptide was absent in CaEXPA4, CaEXPA9, CaEXPB5 and CaEXLB3 (Fig. 1B). Gene structure analysis indicated that CaEXPs had 1–5 introns (Fig. 1C). Most of the CaEXPA family members contained 1–2 introns with a few exceptions; CaEXPA15 and CaEXPA5 had 3 introns and CaEXPA14 had 4 introns (Fig. 1C). All CaEXPB contained 3 introns except CaEXPB2 and CaEXPB7 which had 2 introns each. CaEXLA1 had 4 introns and CaEXLB introns were variable ranging from 2 to 5 (Fig. 1C).

Phylogenetic analysis (A), schematic visualization of protein (B), and gene structure (C) of EXPANSINS in C. annuum. A. Phylogenetic tree performed using the neighbor joining method in MEGA 7.0 with 1000 bootstraps with p-distance model. B. Protein structure showing the signal peptide (pink), double-psi beta-barrel (DPBB; burgundy) and pollen allergen (grey) domains. Scale, 250 amino acids. C. Gene structure with exons in green, introns as a solid line and 5′ and 3′ UTR in blue. Break in second intron of CaEXPA15 is 500 bp
Spatial and temporal transcript abundance patterns of CaEXPA genes
The transcript abundance patterns of 21 CaEXPA genes was determined in seedlings, young and mature leaves, flowers at anthesis, and fruits at 7, 14, 21, 28 DAA and ripe stage (Fig. 2A). Of the 21 CaEXPA genes, 19 displayed expression in the tissues analyzed. The transcripts of CaEXPA1 and CaEXPA11 were not detectable. Among the 19 detectable transcripts, CaEXPA13 showed highest expression in mature leaves and was generally higher in vegetative tissues and flowers in comparison to the fruit (Fig. 2A). CaEXPA3, CaEXPA13, CaEXPA18 and CaEXPA21 displayed highest transcript abundance in the flowers when compared to other tissues (Fig. 2A). In the case of fruit tissues for example, CaEXPA17, CaEXPA19, CaEXPA12, CaEXPA7, and CaEXPA10 showed higher transcript abundance from 7 to 28 DAA and reduced abundance in ripe fruit (Fig. 2A). On the other hand, CaEXPA9 and CaEXPA4 transcript abundance was highest at the ripe fruit stage (Fig. 2A). Only 4 of the 21 CaEXPA genes, CaEXPA3, CaEXPA4, CaEXPA10 and CaEXPA17 were expressed in root and stem tissues (Fig. 2B). Of these, CaEXPA4 showed a substantially higher expression compared to the other genes (Fig. 2B).

Spatio-temporal expression patterns of CaEXPAs. A. Expression patterns of 19 of the 21 CaEXPA genes. Transcript abundance of each CaEXPA gene in every tissue and fruit developmental time-point was normalized to its expression at 7 DAA, except CaEXPA21, which was normalized to its expression in young leaf. Transcripts of CaEXPA1 and CaEXPA11 were not detectable by qRT-PCR. B. Expression patterns of CaEXPAs in root and stem. Only four out of the 21 CaEXPA genes were expressed in root and stem tissue. Transcript abundance of all 4 genes were normalized to that of CaEXPA10 in root. Tissues are displayed vertically and CaEXPA genes horizontally. Color scale from green to red indicates lower and higher transcript abundance, respectively. Expression is presented in a Log2 scale
Temporal transcript abundance patterns of CaEXPAs during fruit growth and development
To identify the abundantly expressed CaEXPA transcripts within the fruit samples, transcript abundance levels of all CaEXPAs in flower and fruit tissues was normalized to that of CaEXPA21 at 7 DAA (Fig. 3). Initially, clustering of the transcript abundance data separated CaEXPA genes into 2 groups, one set with nine genes showing higher expression compared to the other set, with 10 genes displaying lower expression during fruit development (Fig. 3). Of the latter 10 genes, CaEXPA3 was highly expressed at anthesis (Fig. 3; Additional Fig. 2). Of the remaining nine highly abundant transcripts, several patterns of EXPA expression were evident during fruit development. The expression of CaEXPA5, CaEXPA7, CaEXPA12, CaEXPA14 and CaEXPA17 increased significantly from anthesis to 7 DAA and remained high until 21 DAA after which it gradually decreased; the expression of these five genes were positively correlated to each other (Figs. 3 and 4; Table 3). The expression of CaEXPA19 similarly increased significantly from anthesis to 7 DAA, however the peak expression was at 14 DAA after which it gradually decreased and positively correlated with CaEXPA12, CaEXPA14 and CaEXPA17. CaEXPA6 expression was high from 14 to 28 DAA (Figs. 3 and 4; Table 3). CaEXPA9 transcript abundance was high only in ripe fruit and increased by 13.2-fold in ripe fruit as compared with previous stages (anthesis until 28 DAA; Fig. 4). CaEXPA4 as such was not substantially altered during early fruit development, however, its transcript abundance increased by 3.8-fold from 28 DAA until ripening and was negatively correlated with that of CaEXPA5, CaEXPA12, CaEXPA14 and CaEXPA17 (Fig. 4; Table 3).

Temporal expression patterns of CaEXPAs during flower and fruit development. Transcript abundance of all CaEXPA genes was normalized to that of CaEXPA21 at 7 DAA. Tissues are displayed vertically and CaEXPA genes horizontally. Color scale from green to red indicates lower and higher transcript abundance, respectively. Expression is presented in a Log2 scale
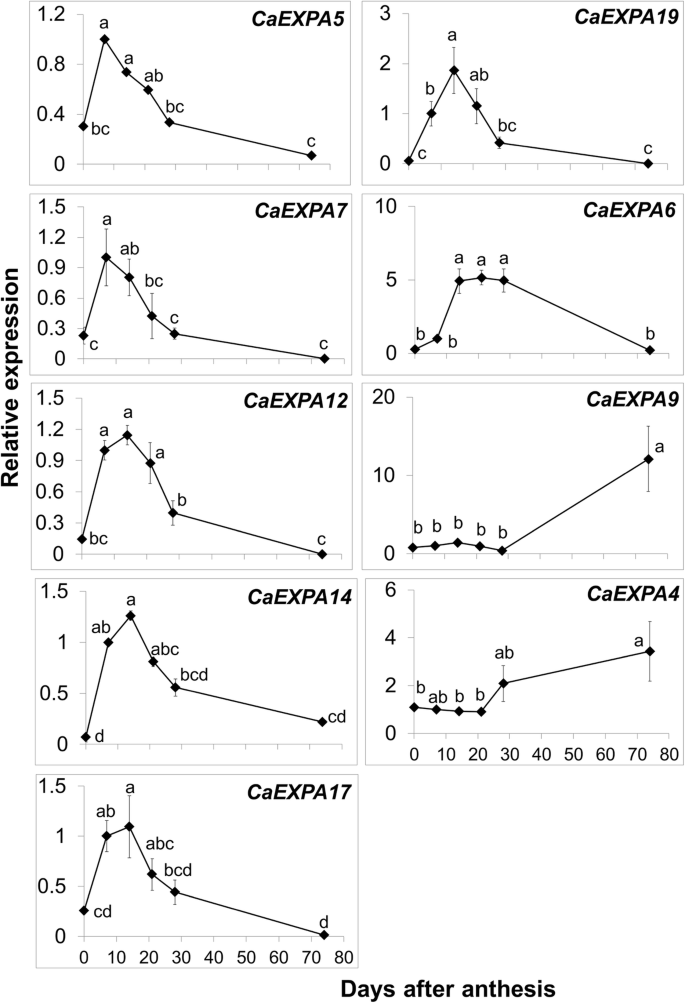
Relative transcript abundance of nine CaEXPA genes in flower and fruit development. These nine CaEXPA genes displayed relatively higher transcript abundance in Fig. 3. Values are means and standard errors of at least three replicates. Means separation was performed using Tukey’s HSD following test of significance using ANOVA (α = 0.05). Means followed by a different letter are significantly different
Fruit growth patterns in bell pepper
Fruit height increased by 3.3-fold between 7 and 14 DAA. It subsequently increased by 1.4-, 1.2- and 1.2-fold between 14 and 21 DAA, 21–28 DAA and 28 DAA-ripe, respectively (Fig. 5A). Increase in fruit diameter was 2.4-fold between 7 and 14 DAA and fold-changes across other developmental time-points were similar to that in fruit height (Fig. 5B). Fruit weight increased by 14.7-fold between 7 and 14 DAA. Subsequently, it increased by 2.7-, 2- and 2.1-fold between 14 and 21 DAA, 21–28 DAA and 28 DAA-ripe, respectively (Fig. 5C). Relative fruit growth was the highest between 7 and 14 DAA; it was 1.5-, 1.6- and 4.8-fold higher in comparison to that between 14 and 21 DAA, 21–28 DAA, and 28 DAA-ripe, respectively (Fig. 5D).
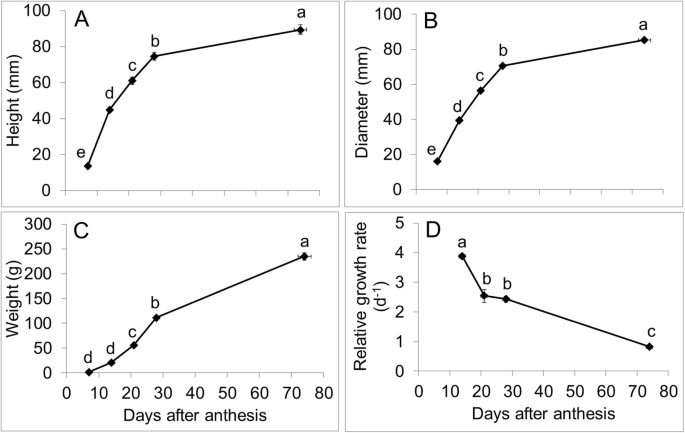
A. Fruit height, B. Fruit diameter, C. Fruit weight at five time-points during fruit development at various days after anthesis (DAA): 7, 14, 21, 28 DAA and ripe stage. D. Relative growth rate calculated using fruit weight (d−1) at four different intervals during fruit growth and development: from 7-14 DAA, 14–21 DAA, 21–28 DAA and 28 DAA to the ripe stage. Means separation was performed using Tukey’s HSD following test of significance using ANOVA (α = 0.05). Means followed by a different letter are significantly different
Cell expansion rate during fruit development and correlation with CaEXPA transcript abundance
Cell area increased gradually during fruit development, particularly between 7 and 28 DAA. Over the course of development, fruit pericarp cell area increased by around 60-fold (Fig. 6A). The relative cell expansion rate was highest between 7 and 14 DAA and subsequently declined over the rest of fruit development (Fig. 6B).

A. Fruit cell area (× 103 μm2) at various stages during fruit development: 0, 7, 14, 21, 28 DAA and ripening. B. Relative fruit cell expansion rate (d− 1) from 0 to 7 DAA, 7–14 DAA, 14–21 DAA, 21–28 DAA and 28 DAA to the ripe stage. Means separation was performed using Tukey’s HSD following test of significance using ANOVA (α = 0.05). Means followed by a different letter are significantly different
Correlations between the transcript abundance and the relative cell expansion rate during fruit growth were performed. Among the highly expressed EXPA genes in the fruit, only the transcript abundance of CaEXPA14 and CaEXPA19 significantly correlated with the relative cell expansion rate (Table 4).
Discussion
The CaEXPA family was the most abundant among the EXPs in bell pepper, similar to that observed in other Solanaceae crops such as tobacco (36 EXPAs) [11], tomato (25 EXPAs, Additional Fig. 3) [12], and potato (24 EXPAs) [13]. This is also true for other species including Arabidopsis, grape, apple, soybean, poplar and rice in which the largest number of EXP genes belong to the EXPA family (Table 1) [14,15,16,17,18,19]. CaEXPs contained 239 to 298 amino acid residues, similar to what was observed in tobacco and tomato [11, 12]. Classification of the CaEXP family was based on identification of conserved amino acids and characteristic domains within each family [21]. Further, the grouping of CaEXP families was confirmed in the phylogenetic analysis. The inconsistencies in the occurrence of the conserved tryptophan residues in CaEXPBs and lack of conservation of the HDF motif in certain CaEXPAs in bell pepper were also noted in EXP gene families from tomato, potato and grape [12, 15, 38]. The differences in conserved amino acid residues may suggest differences in substrate specificity and cell wall loosening activity [12]. The protein domains and exon-intron structure of CaEXP family were similar to other species such as sugarcane [39] and tobacco [11].
The spatial transcript abundance patterns revealed that CaEXPA13 is the most highly expressed EXPA in vegetative tissues such as seedlings, young and mature leaves compared with fruit, suggesting a role in leaf development. Indeed, a transgenic approach has shown that certain EXPAs play a role during leaf initiation and development in Arabidopsis [40] and tobacco [41]. In this study, in comparison with CaEXPA13, CaEXPA18 and CaEXPA21, the transcript abundance of CaEXPA3 was greater in flowers compared to the other tissues and therefore CaEXPA3 may play a role in flower development. In several other studies, expression of EXP has been associated with pollen, stigma, and ovary where it may facilitate pollen tube growth by loosening of stigma cell walls [2, 42, 43]. Further EXPAs have also been shown to regulate petal development in petunia and rose [44, 45]. However, since the entire flower tissue was pooled together in this study, floral organ-specific expression patterns of CaEXPA3 could not be determined. In this study, only 4 out of 21 EXPA genes were expressed in the stem and root tissues, among which CaEXPA4 showed significantly higher expression. Hence it is likely that CaEXPA4 is associated with stem elongation and root growth. The role of certain members of EXP in stem elongation has been well established in rice [20] and root development in Arabidopsis [5].
Fruit growth is one of the longest phases of development. In tomato, although fruit growth does not increase significantly after the mature green stage of development, cell expansion within the pericarp tissue may continue until ripening [46, 47]. The highest rate in cell expansion occurred at 4 DAA in tomato [46]. Our results indicated that in bell pepper, fruit growth and cell expansion occur throughout fruit development until ripening. More frequent sampling during later stages of fruit development is necessary to confirm if these processes continue during ripening. The highest rates of fruit growth and cell expansion occurred during early fruit growth, particularly between 7 and 14 DAA, as clearly evident from the analysis of relative rates of fruit growth and cell expansion. These data suggest that increase in fruit growth during this period is largely facilitated by cell expansion.
Post-mitotic cell expansion-mediated growth is largely driven by the cell turgor pressure, associated with water-uptake, often into the cell vacuoles. During turgor-mediated growth, cell wall stress relaxation occur which results in cell wall loosening [48]. Expansins have been shown to induce cell wall loosening to promote cell wall enlargement by disrupting noncovalent bonds between cellulose microfibrils and xyloglucan [9, 10]. In this study, analysis of temporal transcript abundance patterns revealed higher expression of nine CaEXPA genes in the fruit. These genes displayed varying patterns associated with distinct fruit developmental stages. Although the expression of six genes, CaEXPA5, CaEXPA7, CaEXPA12, CaEXPA14 CaEXPA17 and CaEXPA19 increased during early stages of fruit growth, only the transcript abundance of CaEXPA14 and CaEXPA19 were significantly and positively correlated with the relative rate of cell expansion. These data indicate that at least CaEXPA14 and CaEXPA19 are associated with post-mitotic cell expansion-mediated growth of the bell pepper fruit. In addition, the transcript abundance patterns of CaEXPA14 and CaEXPA19 were strongly and significantly correlated with CaEXPA5, CaEXPA7, CaEXPA12 and CaEXPA17, all of which are upregulated during early stages of fruit growth suggesting they may as well be associated with cell expansion during fruit growth. The transcript abundance of CaEXPA6 was highest between 14 and 28 DAA and therefore CaEXPA6 may facilitate cell expansion during later stages of fruit development. These data indicate that several EXPAs may be important in mediating cell expansion during bell pepper fruit growth. Similarly, the expression of several EXP genes were associated with the expansion of immature fruit in tomato and tubers in potato [12, 13, 29, 38].
Ripening is the final stage of fruit development where multiple textural changes and fruit softening occur, mediated in part by EXPs [29, 33]. Ripening-specific EXPs have been identified in several fruits such as tomato, banana, pear and strawberry [3, 31, 49, 50]. Among the EXPAs analyzed in this study, CaEXPA4 and CaEXPA9 displayed high transcript abundance during late stages of fruit development in bell pepper. These genes did not appear to have substantial changes in transcript abundance during early fruit development; CaEXPA4 increased by 3.8-fold and CaEXPA9 displayed a dramatic rise by over 12-fold from 21 DAA until ripening. Thus, it is likely that CaEXPA9 plays a predominant role in fruit softening during ripening in bell pepper.
Conclusions
This study presents the first genome-wide report of the spatio-temporal expression patterns of EXPA genes in bell pepper. Expression of seven CaEXPA genes, CaEXPA5, CaEXPA6, CaEXPA7, CaEXPA12, CaEXPA14 CaEXPA17 and CaEXPA19 was associated with cell expansion and fruit growth. These results suggest the role of specific CaEXPA genes in facilitating cell expansion during fruit growth. The phase of cell expansion during fruit development is important in contributing to final fruit size in bell pepper. Further, physiological disorders such as blossom-end rot, are initiated during the period of cell expansion, with higher cell expansion rates resulting in potentially greater susceptibility. Functional characterization of these CaEXPA genes may help evaluate their direct roles in regulation of fruit growth and blossom-end rot incidence. This study also revealed CaEXPA9 to be a fruit ripening specific gene which may play a role in ripening associated fruit softening in bell pepper. Thus, CaEXPA9 could be a potential target for slowing down cell wall disassembly during ripening and postharvest storage.
Methods
Plant material
Capsicum annuum cv. Aristotle, a sweet type pepper (Seminis, St. Louis, MO, USA) was grown in the greenhouse from Dec 2017-May 2018 in Athens, GA. Initially, seeds were germinated in plug nursery trays in a low temperature incubator (Model 2015; VWR International, Randor, PA, USA) at 25 °C with 12 h of light and dark. Subsequently the seedlings were transplanted in Fafard 3B Mix Metro-Mix 830 (Sun Gro Horticulture, Agawam, MA, USA) in a 11 L plastic nursery container. During the experiment, the minimum and maximum temperature in the greenhouse was set at 15 °C and 26 °C respectively, with relative humidity at 66%.
Experimental design and tissue collection
A completely randomized design was used and plant tissue samples were harvested in four replicates. Tissues were harvested from seedlings, roots, stems, leaves, flowers, and fruit from five developmental stages. Seedlings (above ground tissue) were harvested 15 days after germination when approximately 4 true leaves were present. Roots, stems, and young and mature leaves were harvested separately from the same plant before flowering. Young leaves were defined as apical and expanding whereas mature leaves were basal and fully expanded. Stem tissue was harvested from the apical region by collecting approximately 3 internodes. Fully open flowers were harvested at anthesis. At anthesis, individual flowers were tagged, manually pollinated and fruit samples were collected at 7 days after anthesis (DAA), 14 DAA, 21 DAA, 28 DAA and at the ripe stage. Fruit was considered ripe when the fruit changed from green to completely red.
Identification and nomenclature of the CaEXP gene families
All CaEXPA sequences were obtained from National Center for Biotechnology Information (NCBI) and SolGenomics databases. All sequences were compared between the two databases and within each database to eliminate identical sequences. The sequences of CaEXPB, CaEXPLA and CaEXPLB were obtained from NCBI database and were compared using Clustal X (http://www.clustal.org/) to determine unique sequences within each gene family. In case of three CaEXP genes, CaEXPA21, CaEXPB6, and CaEXLB6, two transcripts variants were detected in NCBI (Table 2); the longer transcript variant X1 was used for all the subsequent analysis. Nomenclature for all the CaEXP gene sequences within a gene family were in the order of the most recent publication date followed by the chromosomal location information from NCBI. Since all the EXP sequences were from C. annuum cv. Zunla-1 [37], genes were ordered based on their respective chromosomal position (Table 2).
Phylogenetic analysis, protein domain identification and gene structure prediction
The CaEXP sequences were aligned using Clustal X (http://www.clustal.org/). The alignment was verified using the Muscle option on MEGA 7 [51]. The phylogenetic tree was generated using the neighbor joining method on MEGA 7 using p-distance model, partial deletion for missing data treatment and 1000 bootstrap replicates. To identify protein domains, the location of signal peptide, double psi beta-barrel DPBB_1, and Pollen allergen regions in protein sequences were obtained from the software SMART (http://smart.embl-heidelberg.de/) along with PFAM (https://pfam.xfam.org/). For gene structure predictions, the positions of exons, introns, 5′ UTR and 3′ UTR for CaEXPAs were obtained from the NCBI database. Subsequently, visualization of gene and protein structure was performed using GSDS 2.0 (http://gsds.cbi.pku.edu.cn/).
Primer design
Primers for CaEXPAs and reference genes were designed using ApE- A Plasmid Editor (http://jorgensen.biology.utah.edu/wayned/ape/) software (Additional Table 1). Three reference genes, UBIQUITIN-CONJUGATING ENZYME (UBE2, NCBI accession: DQ924970), GLYCERALDEHYDE-3-PHOSPHATE DEHYDROGENASE-(GAPDH, NCBI accession: XM_016722738.1), 18S RIBOSOMAL RNA (18S rRNA, NCBI accession, EF564281.1) were developed to normalize the expression of CaEXPA genes [52]. Of these, two reference genes UBE2 and GAPDH were used for seedling, leaf, flower, and fruit tissues, and GAPDH and 18S rRNA for root and stem tissues. 18S rRNA was used since expression of UBE2 was not detectable in root and stem tissues. All primer pairs were checked for their specificity using NCBI primer-blast (https://www.ncbi.nlm.nih.gov/tools/primer-blast/).
RNA extraction, cDNA synthesis, qRT-PCR and generation of heatmap
For gene expression analyses, a total of four replicates were used for all tissues. For each replicate, to ensure sufficient material for RNA extraction, variable numbers of organs were collected. One replicate consisted of four seedlings, 10 flowers, 10 fruit from 7 DAA, and four fruit for 14 DAA, 21 DAA, 28 DAA and ripe stages. For a single replicate, four young and mature leaves, entire roots, and stem section containing approximately 3 internodes were harvested from a single plant as mentioned previously. All tissue samples were immediately frozen in liquid N2 and stored at − 80 °C until further analysis. RNA from root, stem and fruit tissues was extracted using the protocol described in [53]. However, this protocol did not yield RNA for seedling, leaf and flower and therefore RNA from these tissues was isolated using the E.Z.N.A. Total RNA Kit I (Omega Bio Tek, Norcross, GA) following the “difficult samples protocol” outlined in the manufacturer’s instructions. In the final step, RNA was resuspended in 30–40 μl of diethyl pyrocarbonate (DEPC) - treated water. RNA quality was evaluated using Nanodrop (Thermo Scientific Nanodrop 8000 Spectrophotometer, Waltham, MA) and the 260/280 absorbance was between 2.0 to 2.1 for all samples. The integrity of RNA was visualized on a 1.2% agarose gel with 0.5X Tris-Borate-EDTA (EMD Chemicals Inc., Gibbstown, NJ, USA) buffer. cDNA was prepared from 1 μg of RNA following the manufacturers protocol (Promega, Madison, WI, USA) and diluted to 100 μl [53].
Forward and reverse primers (0.2 μM) and cDNA (1 μl) were combined with PowerUP SYBR Green PCR Master Mix (Applied Biosystems, Foster City, CA, USA) for qRT-PCR reactions using Stratagene MX 3005P qRT-PCR System (Agilent Technologies, CA) following: 50 °C for 2 min, 95 °C for 5 min, followed by 95 °C for 15 s, and 60 °C for 1 min repeated for 40 cycles. This was followed by a melting curve analysis, 95 °C for 1 min, 55 °C for 30 s, 95 °C for 30 s. LinRegPCR (v. 11.0) was used to determine PCR reaction efficiency. Relative gene expression was determined following efficiency correction according to [53]. To generate the heatmap, data were transformed using: Log2 (X + 0.001) where “X” was the fold-change value and 0.001 in the equation accounted for the genes that showed no expression in certain tissues or developmental time-points. Finally heatmap was created in R-3.5.3 using pheatmap-package v.1.0.12 [54]
Fruit growth measurements
Measurements were taken from fruit harvested for gene expression and microscopy analysis (see below). Samples were collected in four replicates, every replicate consisted of multiple fruit: 14 from 7 DAA, 8 from 14 to 28 DAA, and three from ripe fruit. Fruit diameter, height and weight were measured using digital micrometers and scale, respectively. Relative fruit growth was calculated using the formula: \( x=\frac{\ln (w2)-\ln (w1)}{t2-t1} \) where w2 = final fruit weight, w1 = initial fruit weight, t2 = final time in days and t1 = initial time in days.
Microscopy analyses
For microscopy analyses, for each replicate, two flowers and two fruit from each of the developmental stages described above (7–28 DAA) and ripe fruit were used. A total of four replicates were used for each stage of sample collected. Flower and fruit tissue at various developmental stages were harvested into a fixative solution consisting of chromic acid (0.3%), acetic acid (2%) and formaldehyde (10%) (CRAF III) for subsequent microscope analysis. For flower and fruit at 7 DAA, fixed tissues were embedded in the optimum cutting temperature (OCT) compound and sections around 20–30 μm of thickness were prepared using a cryostat microtome (Leica Jung Frigocut 2800 N). Fruit at 14 DAA, 21 DAA and 28 DAA were first cut into ~ 0.5 cm2 sections. Subsequently, sections of around 60 to 120 μm thickness were obtained using a Vibratome 3000 Plus Sectioning System (TED PELLA, INC, Redding, CA, USA). All the sections were stained with 0.1% toluidine blue and images were captured with a BX51 microscope (Olympus, Shinjuku, Tokio, Japan). The images were analyzed using ImageJ software to measure average cell area from 30 cells per section. Relative cell expansion rate was calculated with the formula: \( x=\frac{\ln (a2)-\ln (a1)}{t2-t1} \) where a2 = final cell area, a1 = initial cell area, t2 = final time in days and t1 = initial time in days.
Statistical and correlation analysis
Statistical analysis (one-way analysis of variance for a completely randomized design) was performed using JMP Pro 14 (SAS Institute, Cary, NC, USA). Means were separated using Tukey’s honestly significant difference (HSD) test (α = 0.05). Correlations between cell expansion rate and EXP gene transcript abundance in fruit were determined using pairwise correlations using JMP Pro 14 (SAS Institute, Cary, NC, USA).
Availability of data and materials
Datasets used in the current study are available from the corresponding author on reasonable request.
Abbreviations
- 18S rRNA :
-
18S RIBOSOMAL RNA
- C. annuum :
-
Capsicum annuum
- CBM63:
-
carbohydrate binding module family 63
- CRAF III:
-
chromic acid (0.3%), acetic acid (2%) and formaldehyde (10%)
- DAA:
-
days after anthesis
- DEPC:
-
diethyl pyrocarbonate
- DPBB:
-
double-psi beta-barrel
- EXPs:
-
Expansins
- EXPLA :
-
EXPANSIN A-like
- EXPLB :
-
EXPANSIN B-like
- GAPD :
-
GLYCERALDEHYDE-3-PHOSPHATE DEHYDROGENASE
- GH45:
-
glycosyl hydrolase family 45
- NCBI:
-
National Center for Biotechnology Information
- OCT:
-
optimum cutting temperature
- UBE2 :
-
UBIQUITIN-CONJUGATING ENZYME
- EXPA :
-
α- EXPANSIN
- EXPB :
-
β- EXPANSIN
References
Cosgrove DJ, Li LC, Cho HT, Hoffmann-Benning S, Moore RC, Blecker D. The growing world of expansins. Plant Cell Physiol. 2002;43:1436–44.
Marowa P, Ding A, Kong Y. Expansins: roles in plant growth and potential applications in crop improvement. Plant Cell Rep. 2016;35:949–65.
Rose JKC, Lee HH, Bennett AB. Expression of a divergent expansin gene is fruit-specific and ripening-regulated. Proc Natl Acad Sci U S A. 1997;94:5955–60.
Brummell DA, Harpster MH, Civello PM, Palys JM, Bennett AB, Dunsmuir P. Modification of expansin protein abundance in tomato fruit alters softening and cell wall polymer metabolism during ripening. Plant Cell. 1999;11:2203–16.
Cho HT, Cosgrove DJ. Regulation of root hair initiation and expansin gene expression in Arabidopsis. Plant Cell. 2002;14:3237–53.
Li F, Xing S, Guo Q, Zhao M, Zhang J, Gao Q, et al. Drought tolerance through over-expression of the expansin gene TaEXPB23 in transgenic tobacco. J Plant Physiol. 2011;168:960–6.
Valdivia ER, Stephenson AG, Durachko DM, Cosgrove D. Class B β-expansins are needed for pollen separation and stigma penetration. Sex Plant Reprod. 2009;22:141–52.
Kende H, Bradford KJ, Brummell DA, Cho HT, Cosgrove DJ, Fleming AJ, et al. Nomenclature for members of the expansin superfamily of genes and proteins. Plant Mol Biol. 2004;55:311–4.
Cosgrove DJ. Plant expansins: diversity and interactions with plant cell walls. Curr Opin Plant Biol. 2015;25:162–72.
Sampedro J, Cosgrove DJ. The expansin superfamily. Genome Biol. 2005;6:1–11.
Ding A, Marowa P, Kong Y. Genome-wide identification of the expansin gene family in tobacco (Nicotiana tabacum). Mol Gen Genomics. 2016;291:1891–907.
Lu Y, Liu L, Wang X, Han Z, Ouyang B, Zhang J, et al. Genome-wide identification and expression analysis of the expansin gene family in tomato. Mol Gen Genomics. 2016;291:597–608.
Chen Y, Zhang B, Li C, Lei C, Kong C, Yang Y, et al. A comprehensive expression analysis of the expansin gene family in potato (Solanum tuberosum) discloses stress-responsive expansin-like B genes for drought and heat tolerances. PLoS One. 2019;14:1–21.
Lee Y, Choi D, Kende H. Expansins: ever-expanding numbers and functions. Curr Opin Plant Biol. 2001;4:527–32.
Dal Santo S, Vannozzi A, Tornielli GB, Fasoli M, Venturini L, Pezzotti M, et al. Genome-wide analysis of the Expansin gene superfamily reveals grapevine-specific structural and functional characteristics. PLoS One. 2013;8.
Zhang S, Xu R, Gao Z, Chen C, Jiang Z, Shu H. A genome-wide analysis of the expansin genes in Malus × Domestica. Mol Gen Genomics. 2014;289:225–36.
Zhu Y, Wu N, Song W, Yin G, Qin Y, Yan Y, et al. Soybean (Glycine max) expansin gene superfamily origins: segmental and tandem duplication events followed by divergent selection among subfamilies. BMC Plant Biol. 2014;14:1–19.
Sampedro J, Carey RE, Cosgrove DJ. Genome histories clarify evolution of the expansin superfamily: new insights from the poplar genome and pine ESTs. J Plant Res. 2006;119:11–21.
Sampedro J, Lee Y, Carey RE, DePamphilis C, Cosgrove DJ. Use of genomic history to improve phylogeny and understanding of births and deaths in a gene family. Plant J. 2005;44:409–19.
Lee Y, Kende H. Expression of β-Expansins is correlated with internodal elongation in Deepwater rice. Plant Physiol. 2001;127:645–54.
Choi D, Kim JH, Lee Y. Expansins in plant development. Adv Bot Res. 2008;47:47–97.
McQueen-Mason S, Durachko DM, Cosgrove DJ. Two endogenous proteins that induce cell wall extension in plants. Plant Cell. 1992;4:1425–33.
Cosgrove DJ, Durachko DM. Autolysis and extension of isolated walls from growing cucumber hypocotyls. J Exp Bot. 1994;45:1711–9.
Fleming AJ, McQueen-Mason S, Mandel T, Kuhlemeier C. Induction of leaf primordia by the cell wall protein Expansin. Science. 1997;276:1415–8.
Cho HT, Kende H. Expression of expansin genes is correlated with growth in Deepwater rice. Plant Cell. 1997;9:1661–71.
Lee Y, Kende H. Expression of α-Expansin and Expansin-like genes in Deepwater rice. Plant Physiol. 2002;130:1396–405.
Lee DK, Ahn JH, Song SK, Do CY, Lee JS. Expression of an expansin gene is correlated with root elongation in soybean. Plant Physiol. 2003;131:985–97.
Yu Z, Kang B, He X, Lv S, Bai Y, Ding W, et al. Root hair-specific expansins modulate root hair elongation in rice. Plant J. 2011;66:725–34.
Brummell DA, Harpster MH, Dunsmuir P. Differential expression of expansin gene family members during growth and ripening of tomato fruit. Plant Mol Biol. 1999;39:161–9.
Hayama H, Shimada T, Haji T, Ito A, Kashimura Y, Yoshioka H. Molecular cloning of a ripening-related expansin cDNA in peach: evidence for no relationship between expansin accumulation and change in fruit firmness during storage. J Plant Physiol. 2000;157:567–73.
Hiwasa K, Rose JKC, Nakano R, Inaba A, Kubo Y. Differential expression of seven α-expansin genes during growth and ripening of pear fruit. Physiol Plant. 2003;117:564–72.
Cosgrove DJ. Cell wall loosening by Expansins. Plant Physiol. 1998:333–9.
Gillaspy G, Ben-David H, Gruissem W. Fruits: a developmental perspective. Plant Cell. 1993;5:1439.
Chevalier C, Bourdon M, Pirrello J, Cheniclet C, Gévaudant F, Frangne N. Endoreduplication and fruit growth in tomato: evidence in favour of the karyoplasmic ratio theory. J Exp Bot. 2014;65:2731–46.
Munting AJ. Development of flower and fruit of Capsicum annuum L. Acta Bot Neerl. 1974;23 August:415–432.
Bosland P, Votava E. Peppers: vegetable and spice capsicums. 2nd edition. CAB International, Oxfordshire, U.K; 2012.
Qin C, Yu C, Shen Y, Fang X, Chen L, Min J, et al. Whole-genome sequencing of cultivated and wild peppers provides insights into Capsicum domestication and specialization. Proc Natl Acad Sci U S A. 2014;111:5135–40.
Jung J, O’Donoghue EM, Dijkwel PP, Brummell DA. Expression of multiple expansin genes is associated with cell expansion in potato organs. Plant Sci. 2010;179:77–85.
Santiago TR, Pereira VM, de Souza WR, Steindorff AS, Cunha BADB, Gaspar M, et al. Genome-wide identification, characterization and expression profile analysis of expansins gene family in sugarcane (Saccharum spp.). PLoS One. 2018;13:1–18.
Cho HT, Cosgrove DJ. Altered expression of expansin modulates leaf growth and pedicel abscission in Arabidopsis thaliana. Proc Natl Acad Sci U S A. 2000;97:9783–8.
Kuluev BR, Safiullina MG, Knyazev AV, Chemeris AV. Effect of ectopic expression of NtEXPA5 gene on cell size and growth of organs of transgenic tobacco plants. Russ J Dev Biol. 2013;44:28–34.
Mollet JC, Leroux C, Dardelle F, Lehner A. Cell wall composition, biosynthesis and remodeling during pollen tube growth. Plants. 2013;2:107–47.
Cosgrove DJ, Bedinger P, Durachko DM. Group I allergens of grass pollen as cell wall-loosening agents. Proc Natl Acad Sci U S A. 1997;94:6559–64.
Zenoni S, Reale L, Tornielli GB, Lanfaloni L, Porceddu A, Ferrarini A, et al. Downregulation of the Petunia hybrida α-Expansin gene PhEXP1 reduces the amount of crystalline cellulose in cell walls and leads to phenotypic changes in petal limbs. Plant Cell. 2004;16:295–308.
Dai F, Zhang C, Jiang X, Kang M, Yin X, Lü P, et al. RhNAC2 and RhEXPA4 are involved in the regulation of dehydration tolerance during the expansion of rose petals. Plant Physiol. 2012;160:2064–82.
Renaudin JP, Deluche C, Cheniclet C, Chevalier C, Frangne N. Cell layer-specific patterns of cell division and cell expansion during fruit set and fruit growth in tomato pericarp. J Exp Bot. 2017;68:1613–23.
Cheniclet C, Rong WY, Causse M, Frangne N, Bolling L, Carde JP, et al. Cell expansion and endoreduplication show a large genetic variability in pericarp and contribute strongly to tomato fruit growth. Plant Physiol. 2005;139:1984–94.
Cosgrove DJ. Diffuse growth of plant cell walls. Plant Physiol. 2018;176:16–27.
Civello PM, Powell ALT, Sabehat A, Bennett AB. An expansin gene expressed in ripening strawberry fruit. Plant Physiol. 1999;121:1273–9.
Trivedi PK, Nath P. MaExp1, an ethylene-induced expansin from ripening banana fruit. Plant Sci. 2004;167:1351–8.
Kumar S, Stecher G, Tamura K. MEGA7: molecular evolutionary genetics analysis version 7.0 for bigger datasets. Mol Biol Evol. 2016;33:1870–4.
Cheng Y, Pang X, Wan H, Ahammed GJ, Yu J, Yao Z, et al. Identification of optimal reference genes for normalization of qPCR analysis during pepper fruit development. Front Plant Sci. 2017;8:1–14.
Vashisth T, Johnson LK, Malladi A. An efficient RNA isolation procedure and identification of reference genes for normalization of gene expression in blueberry. Plant Cell Rep. 2011;30:2167–76.
Kolde R. Package ‘pheatmap.’ 2019;1–8.
Acknowledgements
We thank John Doyle for helping with the set-up of the experiment in the greenhouse. We thank Anish Malladi and Dayton Wilde for critically reviewing the manuscript.
Footnotes
Not applicable
Funding
This publication was supported by the U.S. Department of Agriculture’s (USDA) Agricultural Marketing Service through grant 16SCBGPGA0010. Its contents are solely the responsibility of the authors and do not necessarily represent the official views of the USDA.
Author information
Authors and Affiliations
Contributions
AM-G and SUN conceived the study and designed the experiments. AM-G was involved in data collection and processing of samples for microscopy and gene expression. AM-G and SUN were involved in data analysis, preparation of figures and preparation of the manuscript. The author(s) read and approved the final manuscript.
Corresponding author
Ethics declarations
Ethics approval and consent to participate
Not applicable.
Consent for publication
Not applicable.
Competing interests
The authors declare that they have no competing interests.
Additional information
Publisher’s Note
Springer Nature remains neutral with regard to jurisdictional claims in published maps and institutional affiliations.
Supplementary information
Additional file 1: Table 1.
Primers for CaEXPAs and reference genes.
Additional file 2: Figure 1.
Alignment of all EXP protein sequences from C. annuum and representative sequences from Arabidopsis for each family, EXPA, EXPB, EXPLA, and EXPLB. All conserved amino acids are shown above the alignments for each family based on [21].
Additional file 3: Figure 2.
Relative transcript abundance of 10 CaEXPA genes in flower and fruit development. These 10 CaEXPA genes displayed relatively lower transcript abundance during fruit development in Fig. 3. Values are means and standard errors of at least three replicates. Means separation was performed using Tukey’s HSD following test of significance using ANOVA (α = 0.05). Means followed by a different letter are significantly different.
Additional file 4: Figure 3.
Phylogenetic analyses of EXPANSINS in bell pepper, tomato, Arabidopsis and rice. Phylogenetic tree performed using the neighbor joining method in MEGA 7.0 with 1000 bootstraps with p-distance model. Tomato sequences were obtained from [12], Arabidopsis from TAIR (https://www.arabidopsis.org/browse/genefamily/expansin.jsp) [14]; and rice (http://personal.psu.edu/fsl/ExpCentral/other_species.htm#rice%20sequences) [18].
Rights and permissions
Open Access This article is licensed under a Creative Commons Attribution 4.0 International License, which permits use, sharing, adaptation, distribution and reproduction in any medium or format, as long as you give appropriate credit to the original author(s) and the source, provide a link to the Creative Commons licence, and indicate if changes were made. The images or other third party material in this article are included in the article's Creative Commons licence, unless indicated otherwise in a credit line to the material. If material is not included in the article's Creative Commons licence and your intended use is not permitted by statutory regulation or exceeds the permitted use, you will need to obtain permission directly from the copyright holder. To view a copy of this licence, visit http://creativecommons.org/licenses/by/4.0/. The Creative Commons Public Domain Dedication waiver (http://creativecommons.org/publicdomain/zero/1.0/) applies to the data made available in this article, unless otherwise stated in a credit line to the data.
About this article

Cite this article
Mayorga-Gómez, A., Nambeesan, S.U. Temporal expression patterns of fruit-specific α- EXPANSINS during cell expansion in bell pepper (Capsicum annuum L.). BMC Plant Biol 20, 241 (2020). https://doi.org/10.1186/s12870-020-02452-x
Received:
Accepted:
Published:
DOI: https://doi.org/10.1186/s12870-020-02452-x