Fig. 11

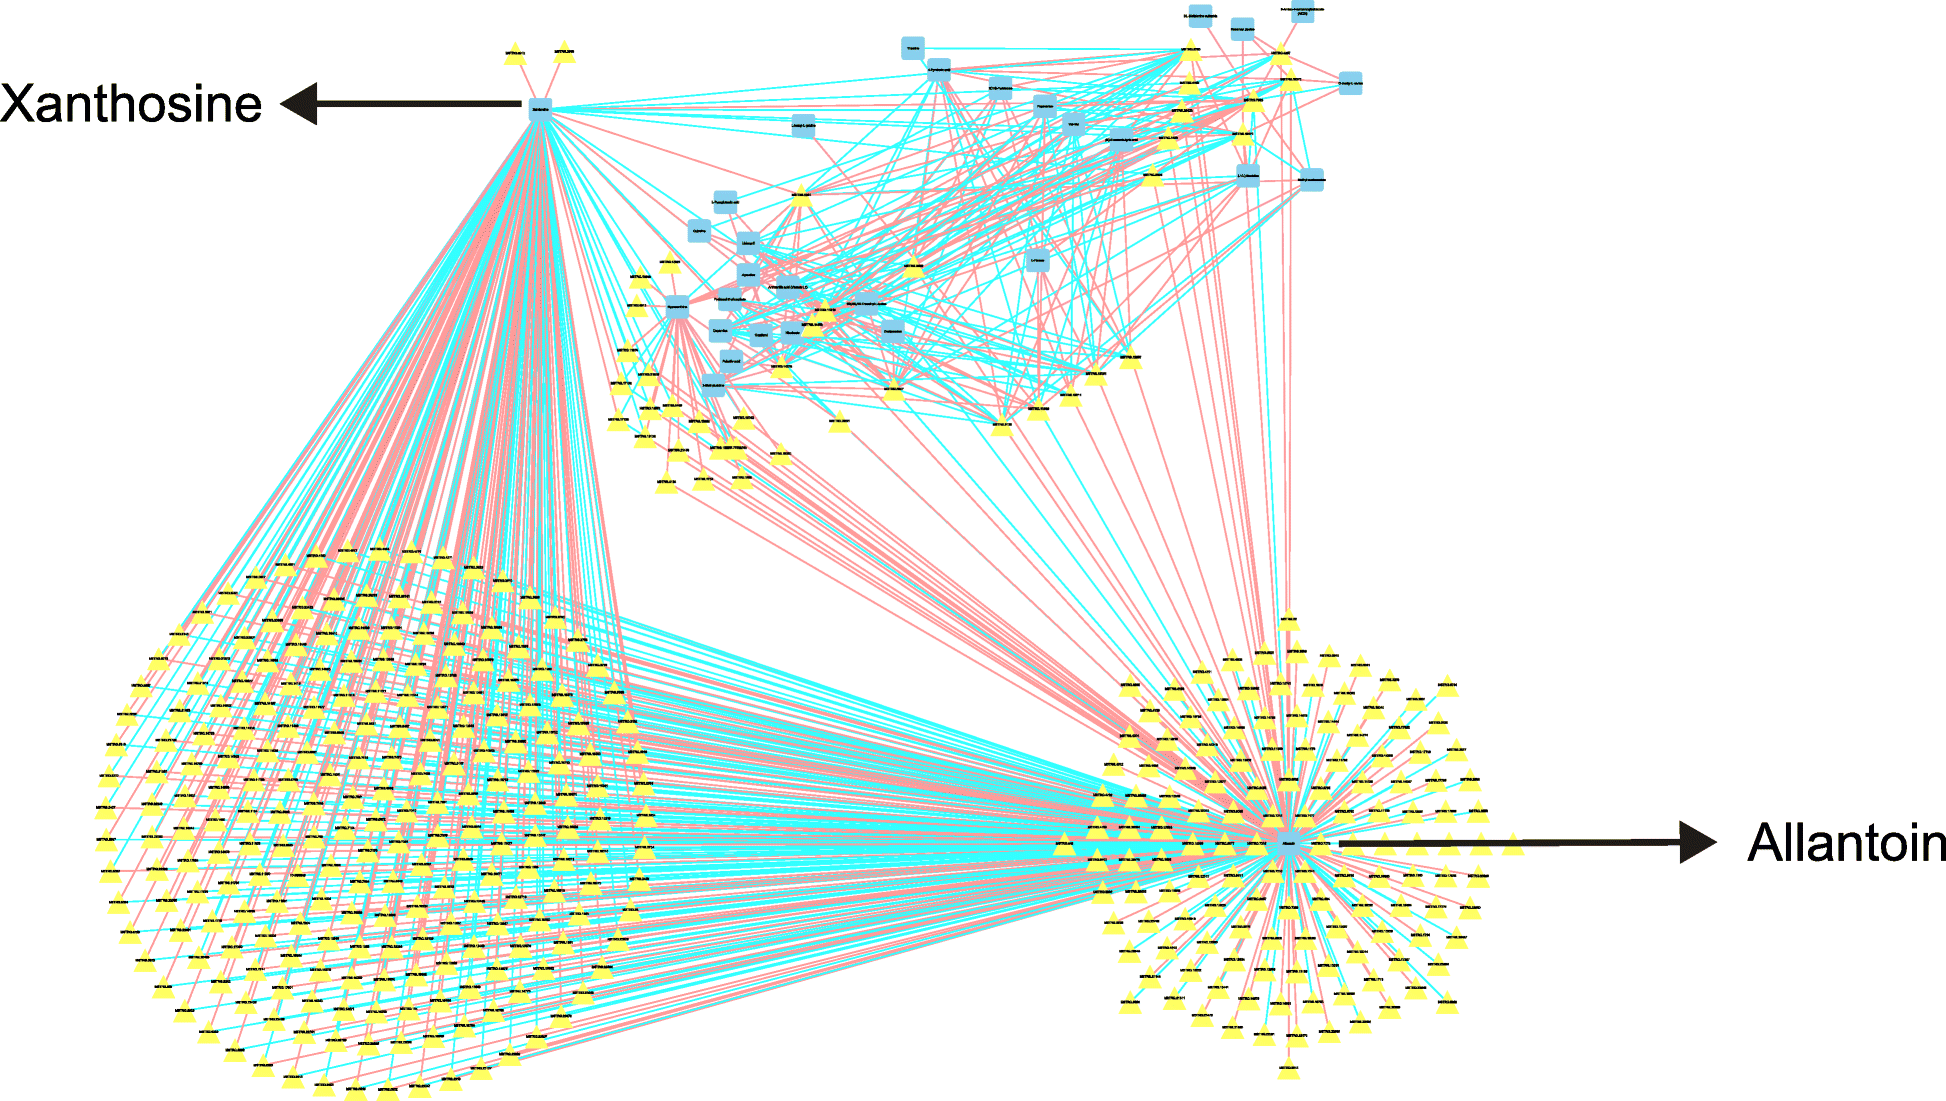
Pearson correlation analysis of differential genes and metabolites under all salt stress on day 7 (r > 0.5, P < 0.05). Squares represent metabolites, and triangles represent genes. The same type of metabolite or gene is marked with the same color. The connection between genes and metabolites represents a correlation between the two, with red representing a positive correlation and blue representing a negative correlation