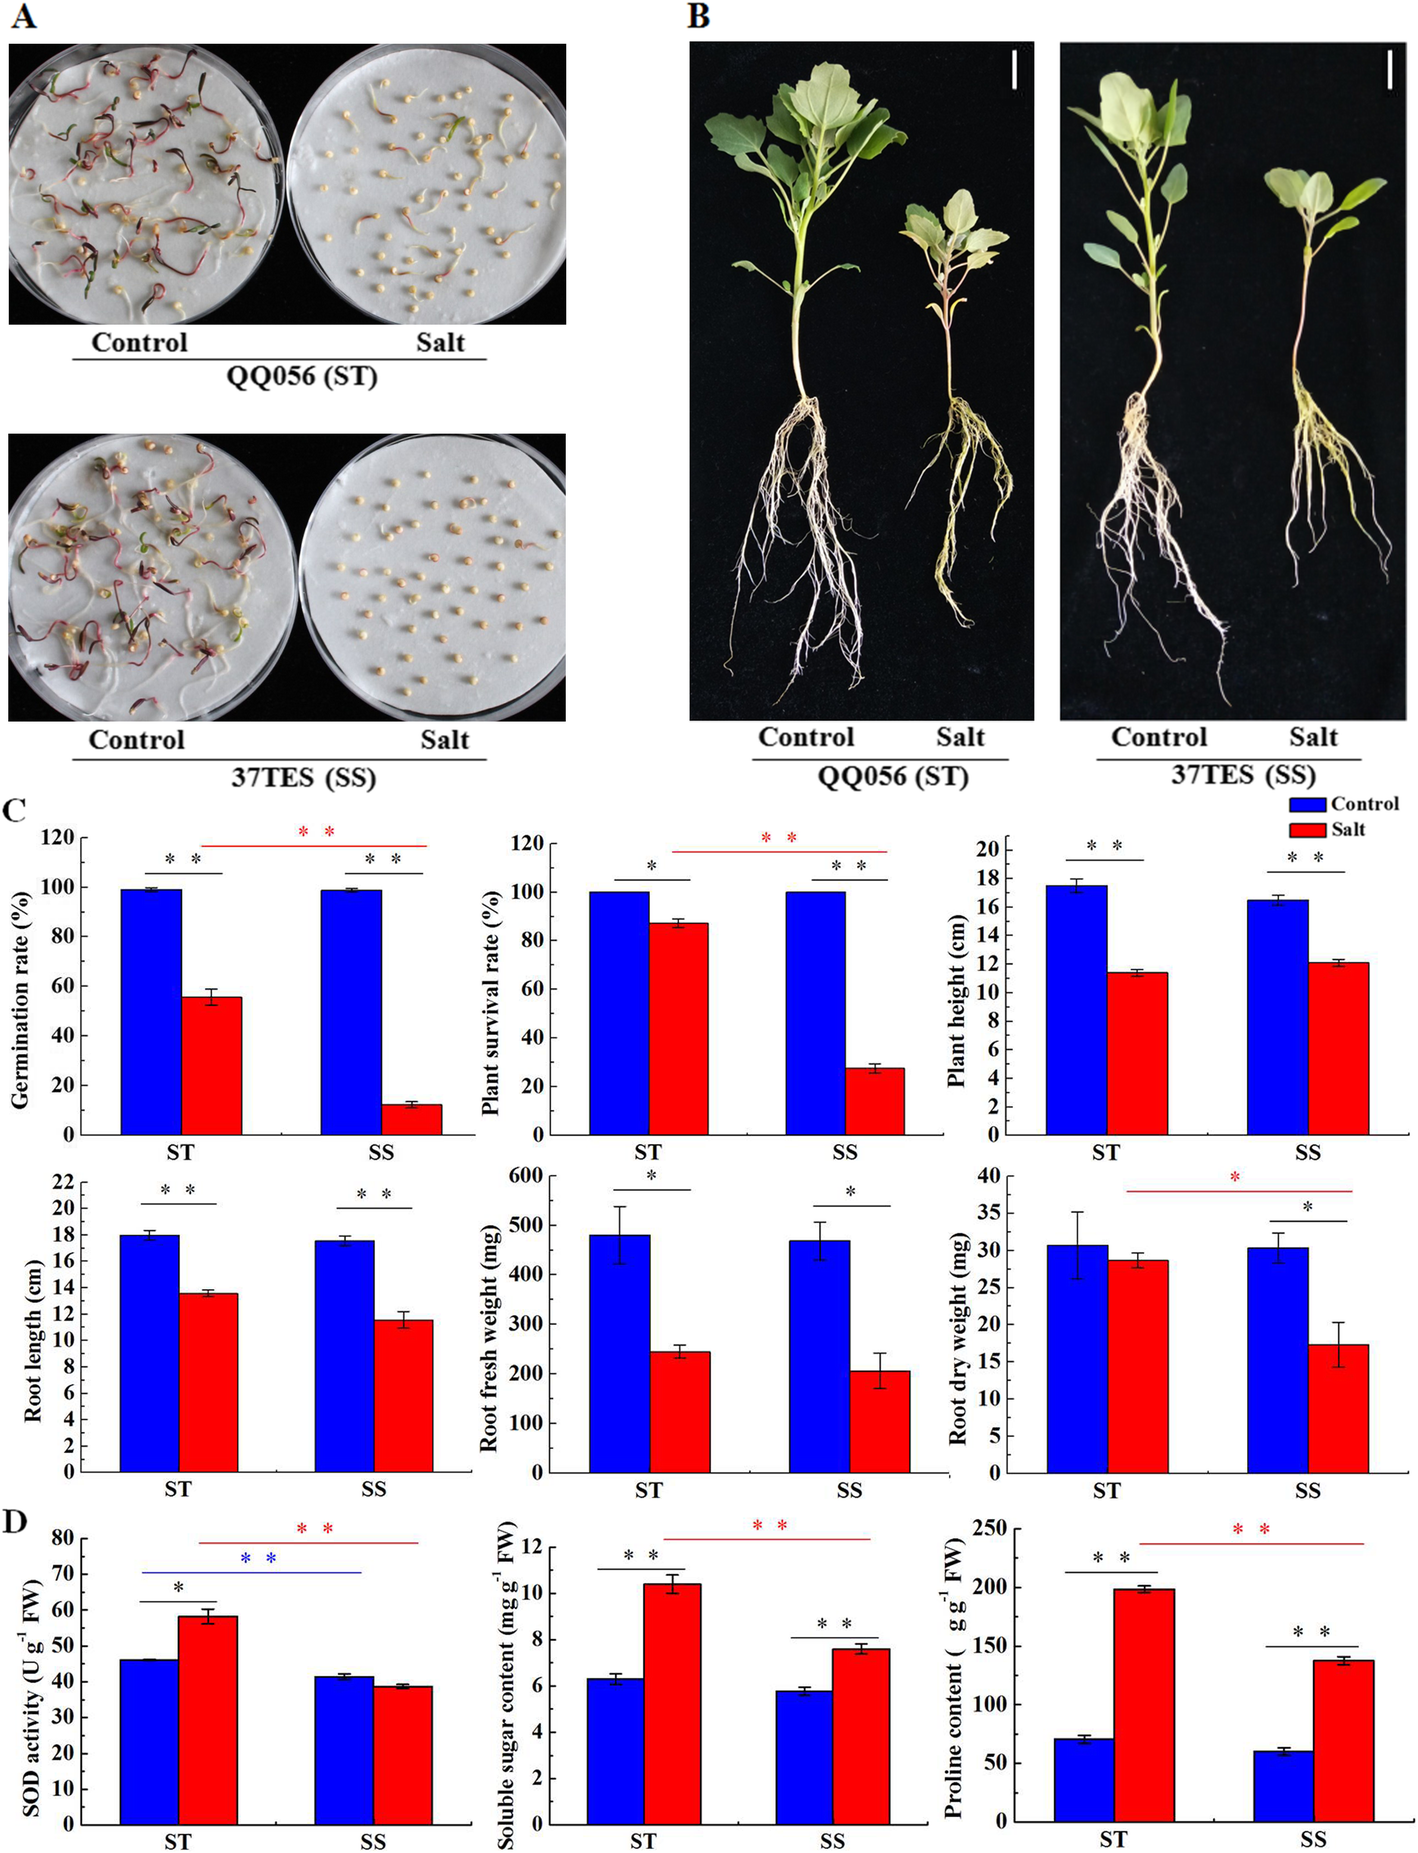
Fig. 1

Morphological changes of salt-tolerant (ST) and salt-sensitive (SS) genotypes under salinity stress. a Germination of ST and SS under control and 300 mM NaCl conditions. b Phenotypic changes of ST and SS when 28-day-old seedlings were exposed to 300 mM NaCl for 14 d. c Changes in seed germination rate, plant survival rate, plant height, root length, root fresh weight and root dry weight of ST and SS under control and NaCl treatments. d Comparative analysis of SOD activity, soluble sugar content and proline content between different groups and treatments. Scale bars = 2 cm. Multiple comparisons were performed with significant difference (*P < 0.05, **P < 0.01, one-way ANOVA and Tukey’s test; Error bars represent SD)