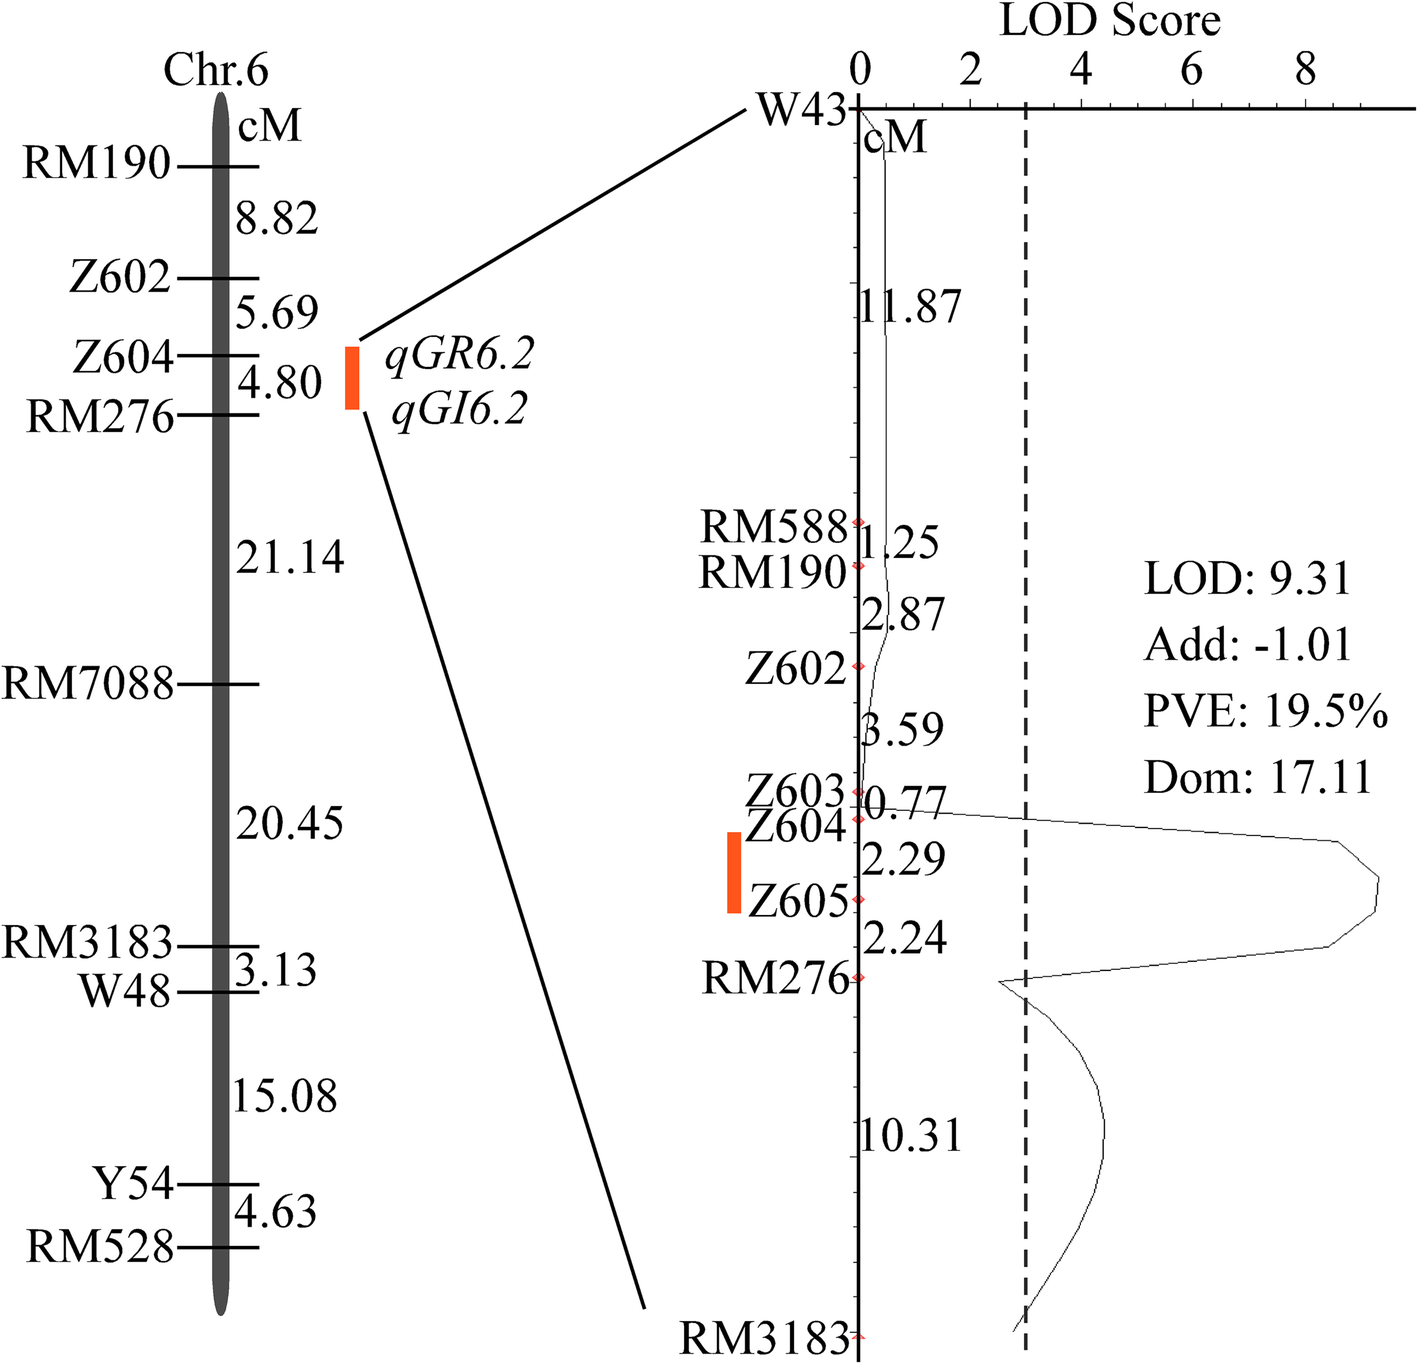
Fig. 4

QTL mapping and validation of qGR6.2. On the left, the red line represents the region of QTLs among the BC1F2 population, on the right, validation of qGR6.2 among the BC2F2 population under 300 mM NaCl conditions. The LOD curve indicates the strength of evidence for the presence of qGR6.2 within Z604~Z605 on chromosome 6. Dashed lines show LOD thresholds of 3.0. Marker names and genetic distances are shown on the right of the chromosome. Chr., chromosome; cM, centimorgan; LOD, the likelihood of odds; PVE, phenotypic variation explained by QTL; ADD, the additive effect of substituting a WJZ allele for a Nip allele, which its negative value indicates that WJZ contains the positive allele; DOM, dominance effect