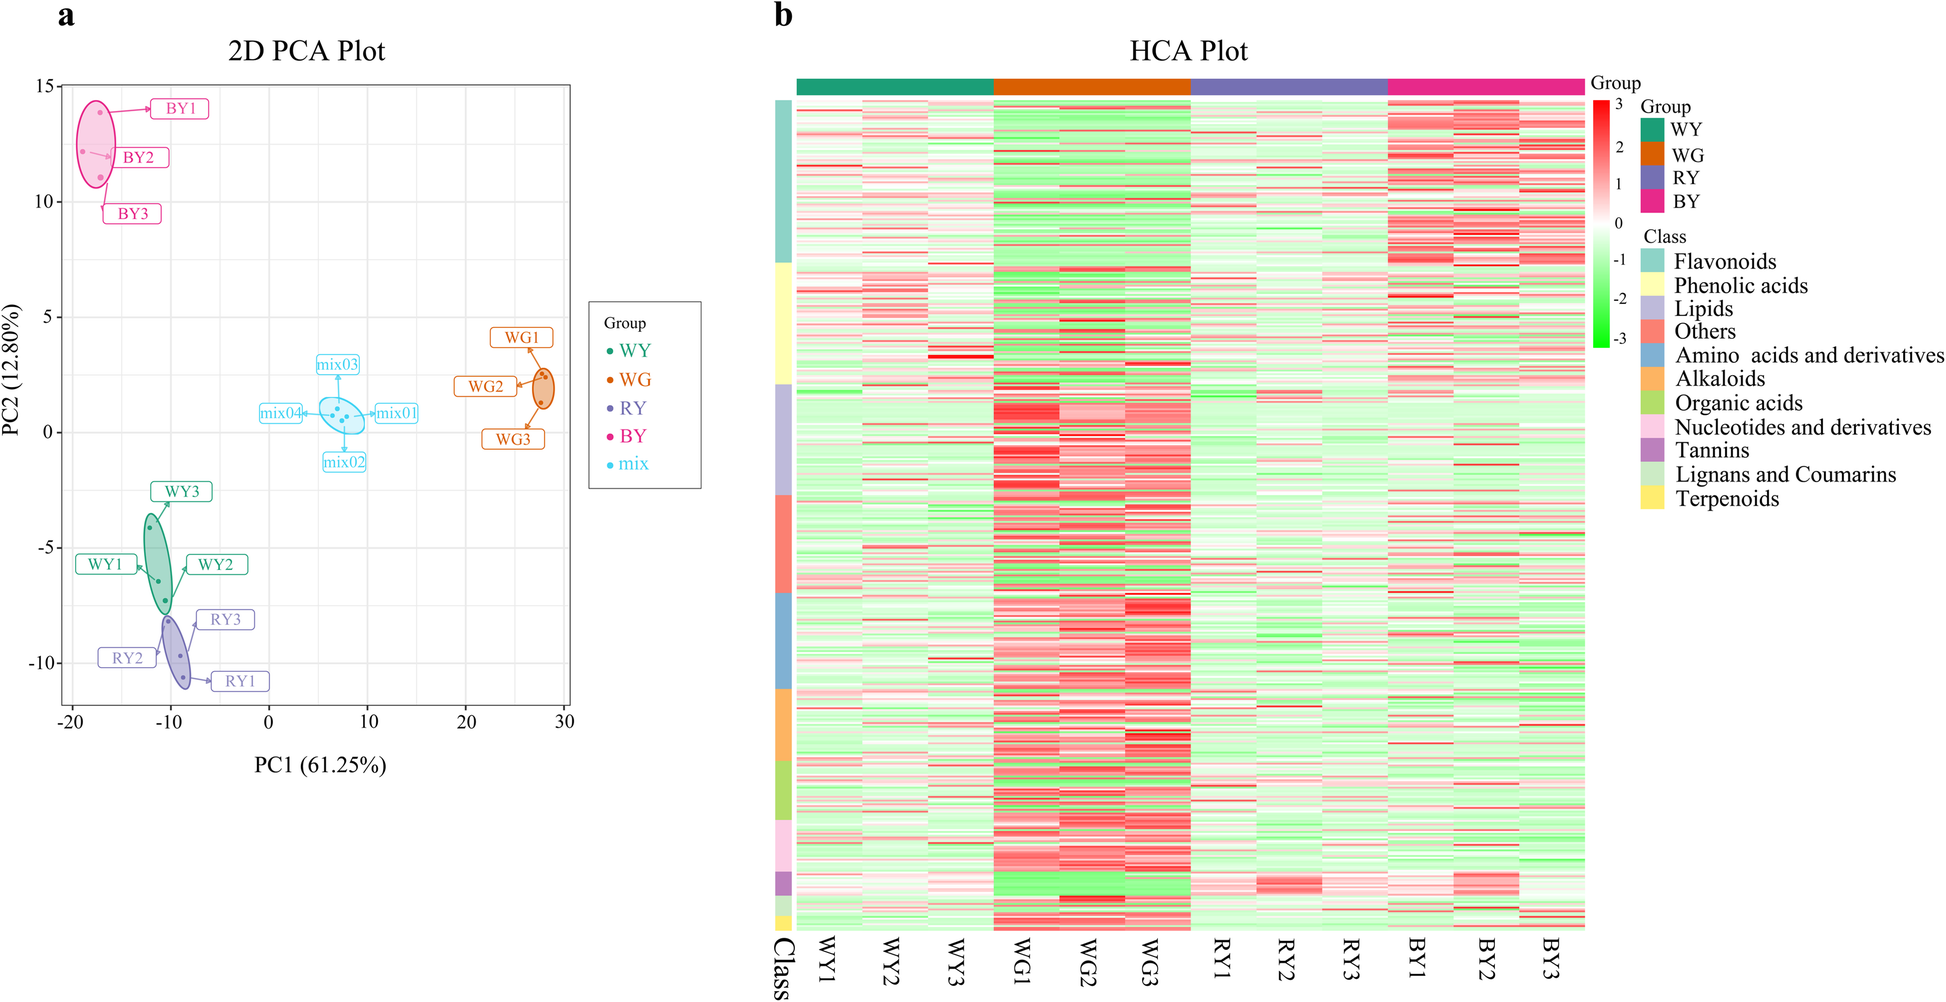
Fig. 2

Results of PCA and HCA analyses of 12 samples from S. glabra. a In PCA plot, PC1 (61.25% variance) and PC2 (12.8% variance) were used to generate the scores plot. Samples of WY, RY, BY, WG, and mix are marked in green, purple, pink, brown, and blue, respectively. The mix sample is a quality-control sample that was made of an equal mixture of all samples. b In HCA plot, all the identified metabolites were divided into 11 classes, and each coloured rectangle represented the specific compound content. WY: Leaf tissue under white LED light; WG: Root tissue under white LED light; BY: Leaf tissue under blue LED light; RY: Leaf tissue under red LED light