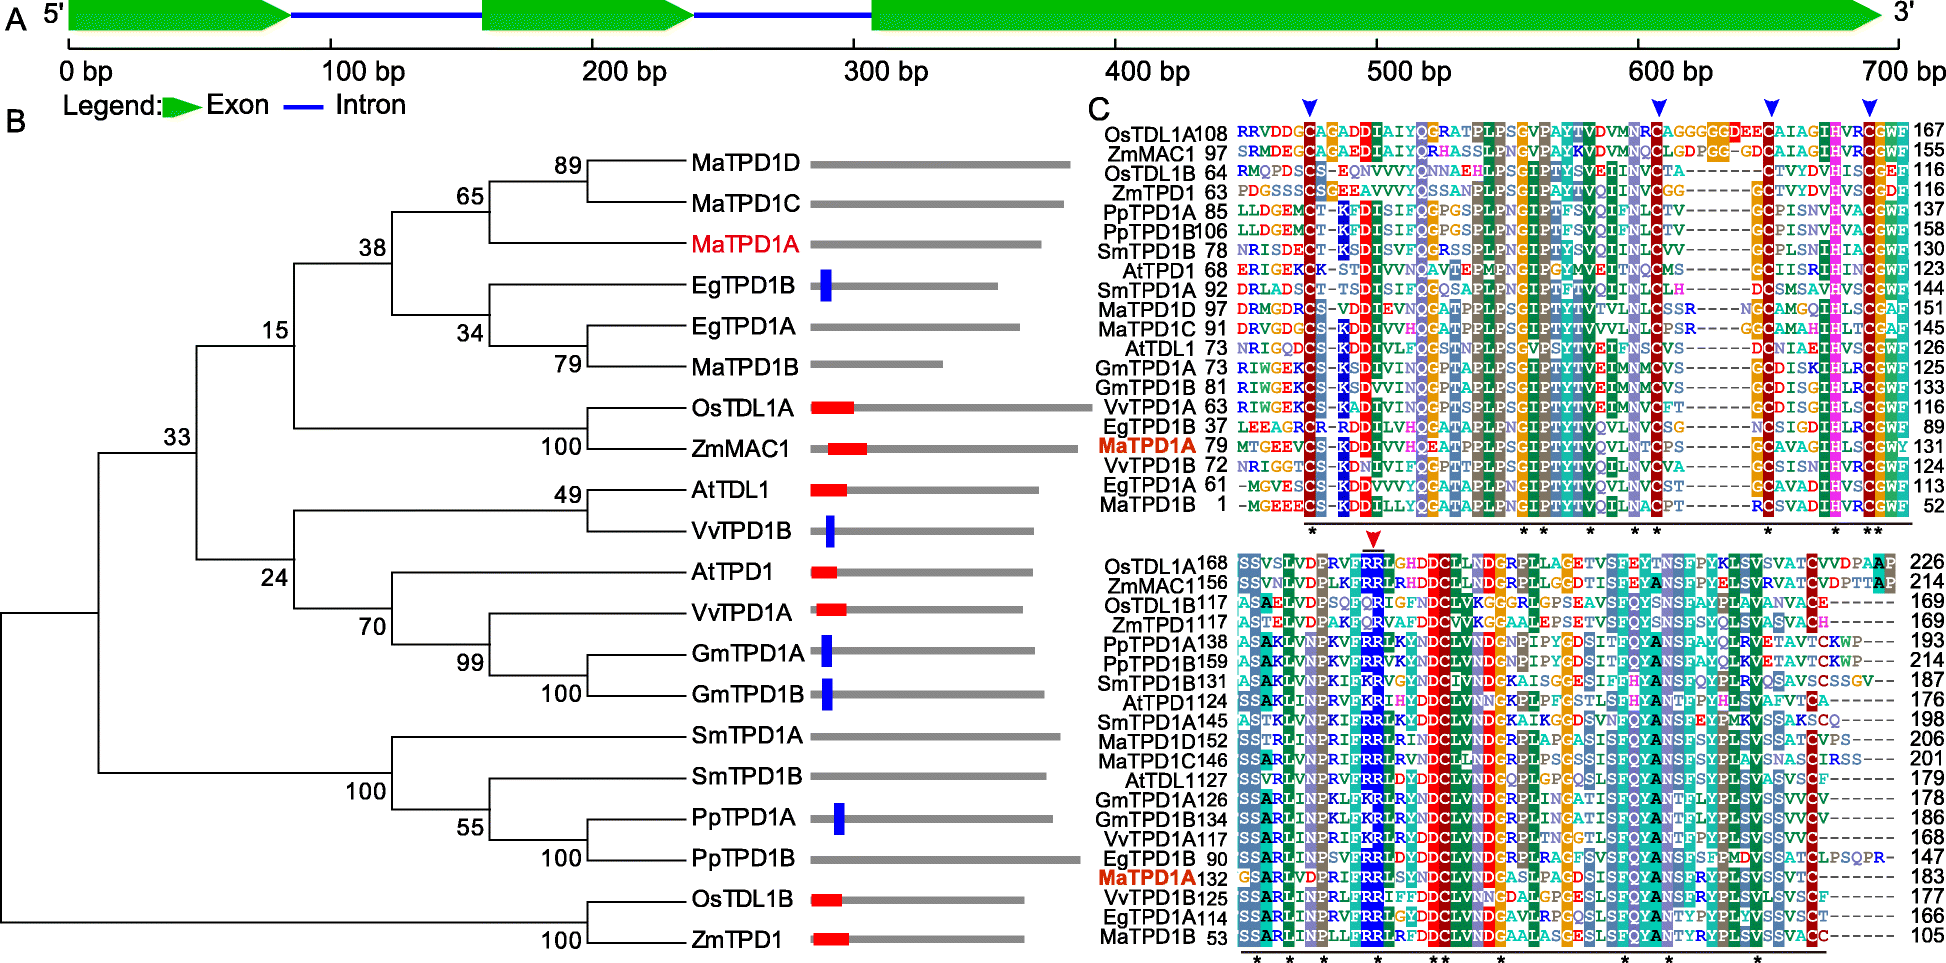
Fig. 1

Sequence analysis of banana TPD1 homologs. a Schematic representation of the sequence organization of MaTPD1A. b Phylogenetic analysis of TPD1 and the related homologs. The amino acid sequences were aligned using Clustal Omega, and the tree was drawn with the neighbor-joining method using MEGA software 5.0 (http://megasoftware.net/). The architecture of each gene was obtained from SMART using the architecture analysis function. The red frame indicates a signal peptide; the blue frame indicates a transmembrane domain. EgTPD1A, PpTPD1B, SmTPD1A, SmTPD1B, MaTPD1A, MaTPD1C, and MaTPD1D had no matches in the SMART database. Detailed sequence information is as follows: AtTPD1 (AAR25553.1); AtTDL1 (ABF59206.1); EgTPD1A (XP_010936413.1); EgTPD1B (XP_019703285.1); GmTPD1A (XP_006581852.1); GmTPD1B (XP_014630314.1); OsTDL1A (BAG98429.1); OsTDL1B (BAH00567.1); PpTPD1A (XP_024360232.1); PpTPD1B (XP_024403645.1); SmTPD1A (XP_002981330.2); SmTPD1B (XP_002966893.2); VvTPD1A (XP_002280540.1); VvTPD1B (XP_010646260.1); ZmMAC1 (AEN03028.1); ZmTPD1 (ACG48634.1); MaTPD1A (Ma00_p03730.1); MaTPD1B (Ma08_p27040.1); MaTPD1C (Ma06_p07710.1); and MaTPD1D (Ma09_p01210.1). c CLUSTAL Omega alignment of TPD1 from various organisms showing the highly conserved region. At, Arabidopsis thaliana; Eg, Elaeis guineensis; Gm, Glycine max; Os, Oryza sativa Japonica Group; Pp, Physcomitrella patens; Sm, Selaginella moellendorffii; Vv, Vitis vinifera; Zm, Zea mays; Ma, Musa acuminata. The underlined region was the conserved C-terminal domain of TPD1 and its homologs; Blue arrow indicates the conserved cysteine residues that are essential for the normal function of AtTPD1; Red arrow representates the dibasic cleavage site of AtTPD1. Star indicates amino acids that are identical in all sequences