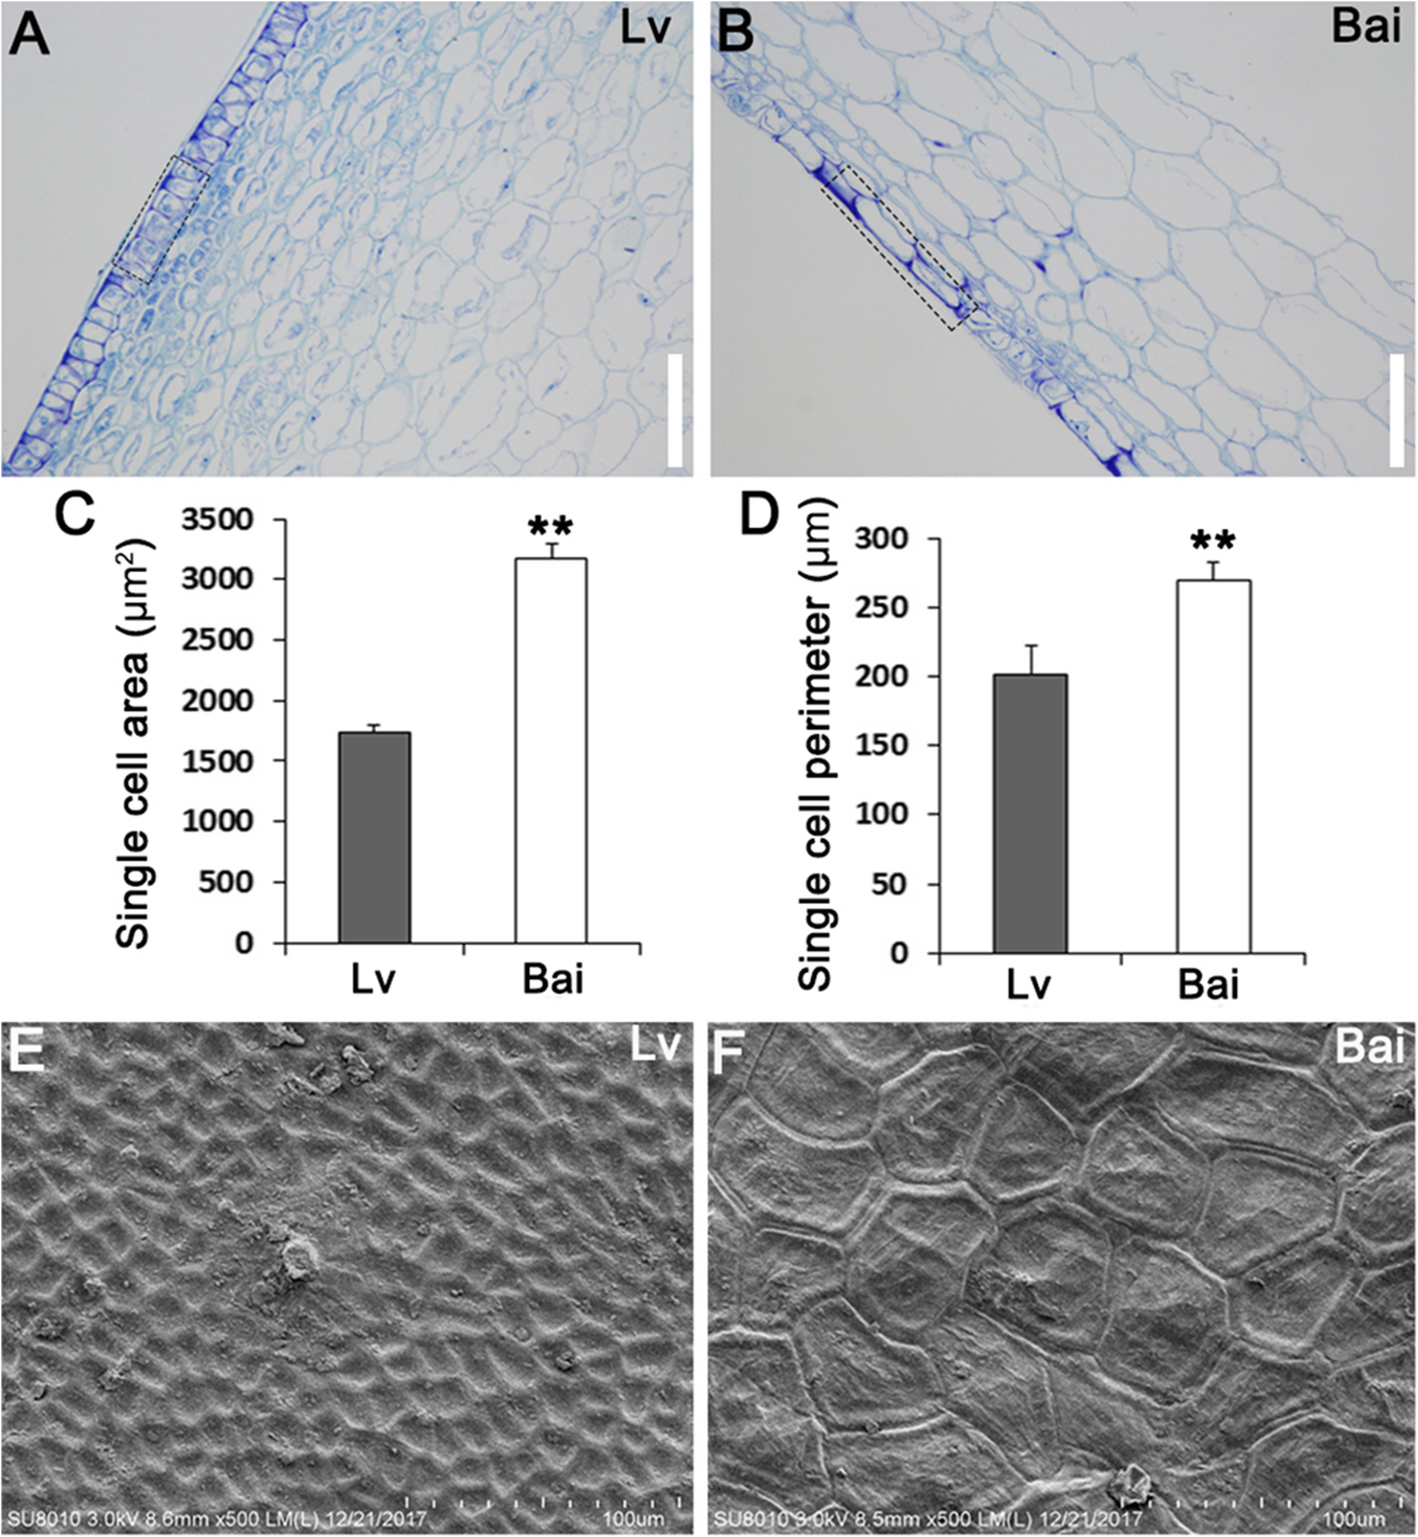
Fig. 3

Epidermal cells from Bai showed larger single cell area and perimeter. a, b Observation of paraffin section of fruit skins from Lv (a) and Bai (b). c Single cell area of epidermal cells from Lv and Bai fruit skins. d Single cell perimeter of epidermal cells from Lv and Bai fruit skin. e, f SEM observation of fruit skin from Lv (e) and Bai (f). Scar bar in (a, b): 150 μm. Data is presented as the mean ± standard deviation (n = 9). *0.01 ≤ P ≤ 0.05, **P ≤ 0.01, Student’s t test