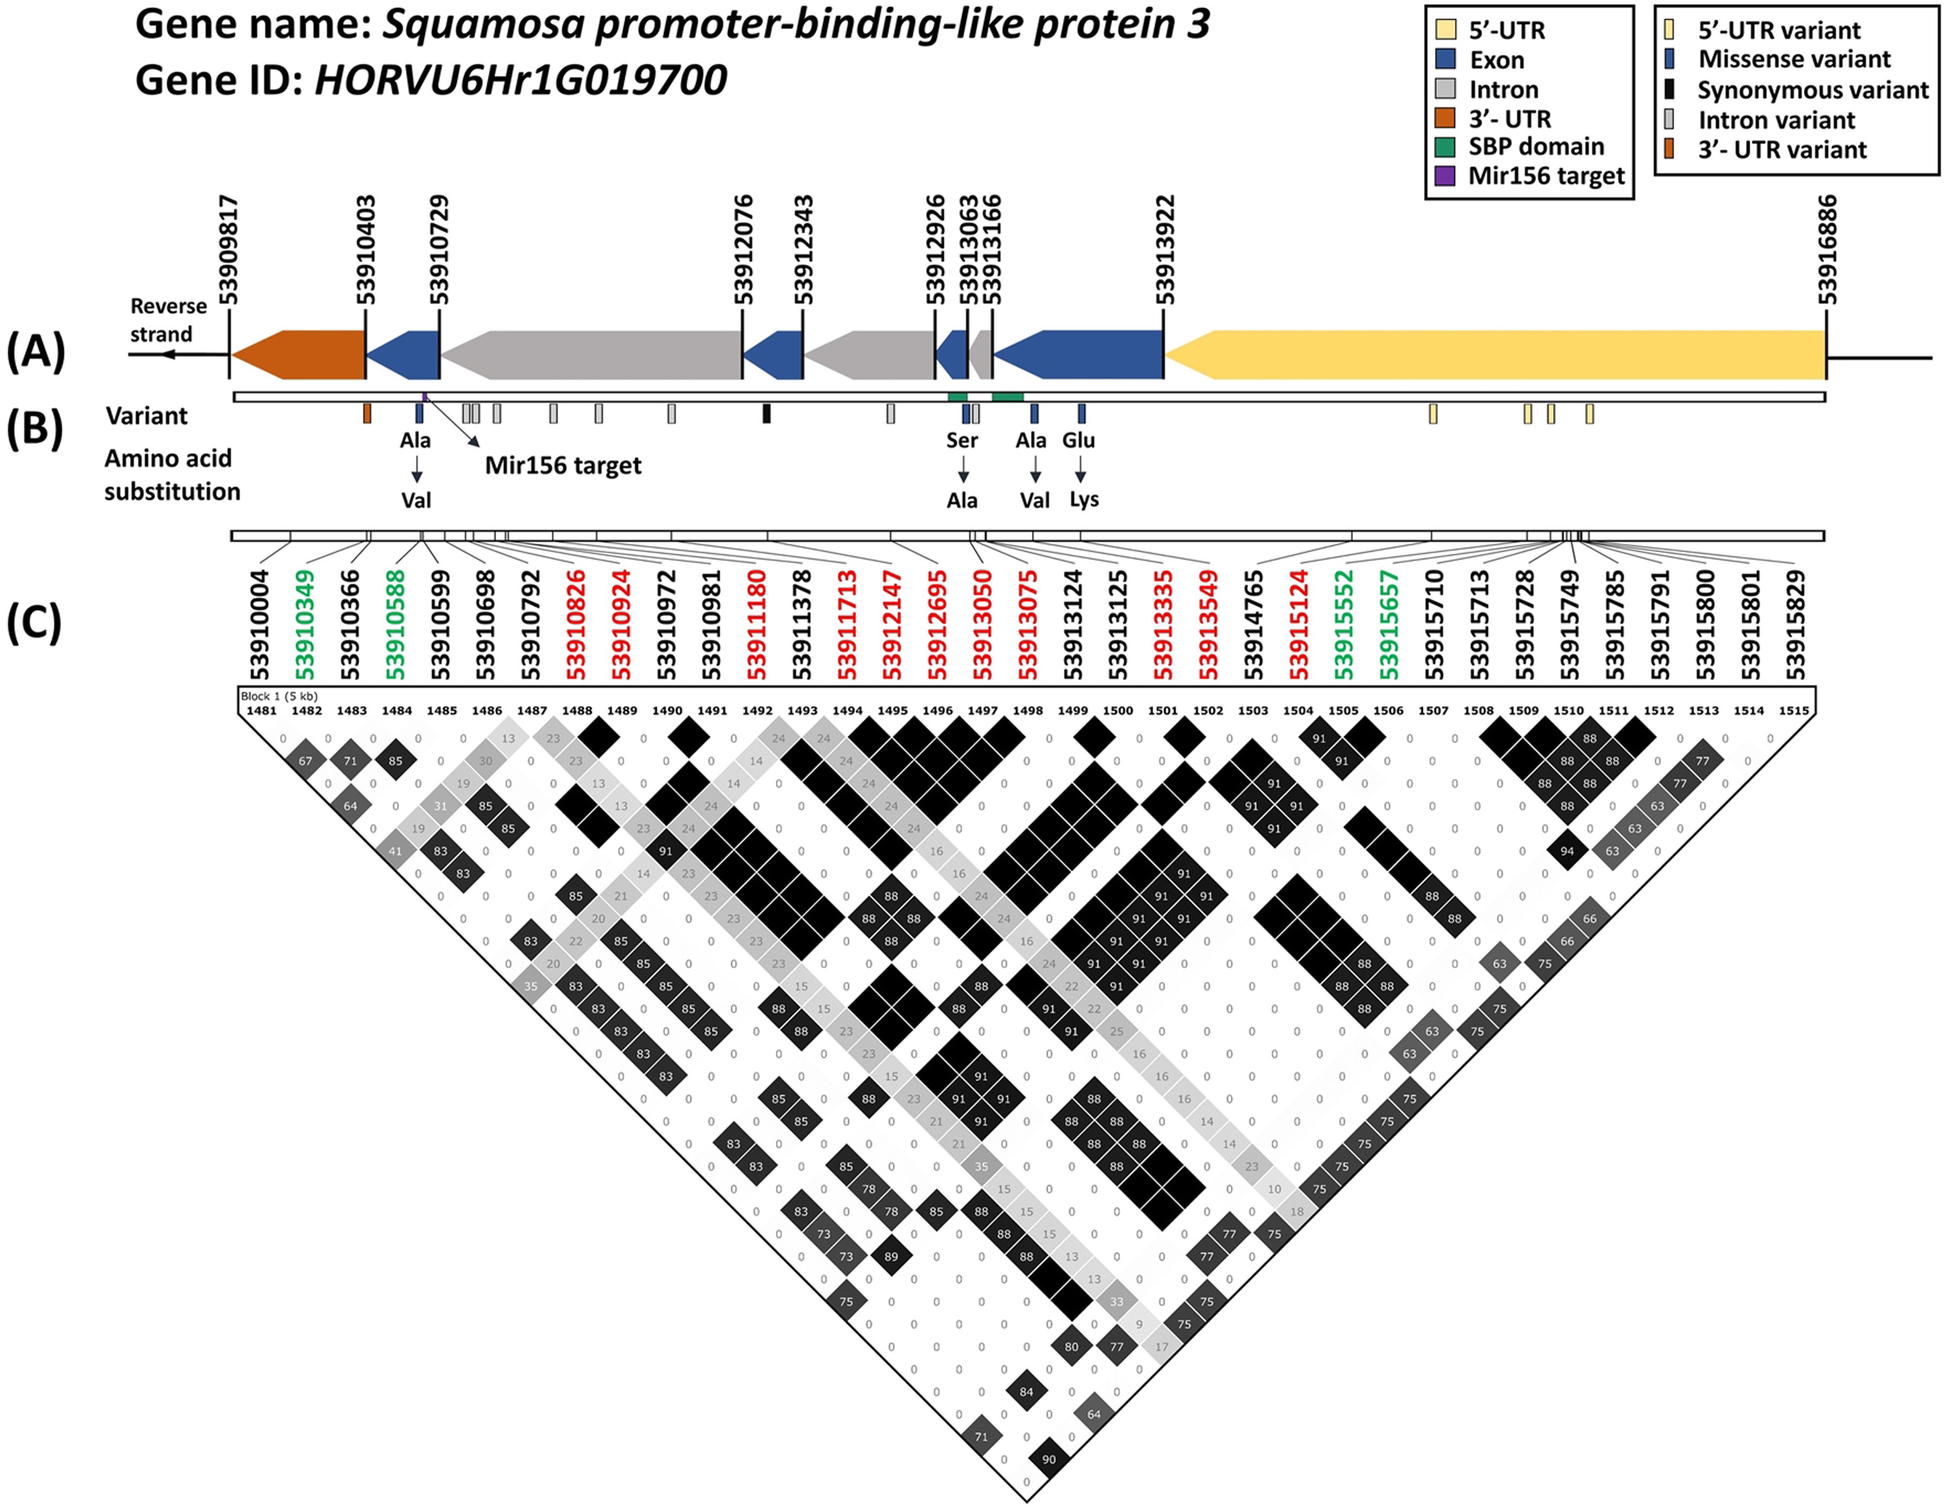
Fig. 4

Summary of the SPL3 gene structure, amino acid substitution and the local LD haplotype blocks. a The gene structure was annotated in barley genome assembly IBSC v2. b the amino acid substitutions were predicted by detected GWAS markers. (c) The LD plot (made by Haploview) showed the r2 values between pairs of SNPs (× 100); white colour indicated r2 = 0; grey colour indicated 0 < r2 < 1; black colour indicated r2 = 1. The four-gamete rule method was used to compute the haplotype block in the SPL3 genomic region. The green font showed the SNPs with significant association (0.01 < q value< 0.05) in the GLM model. The red font showed the SNPs with highly significant association (q value< 0.01) in the GLM model