Fig. 1
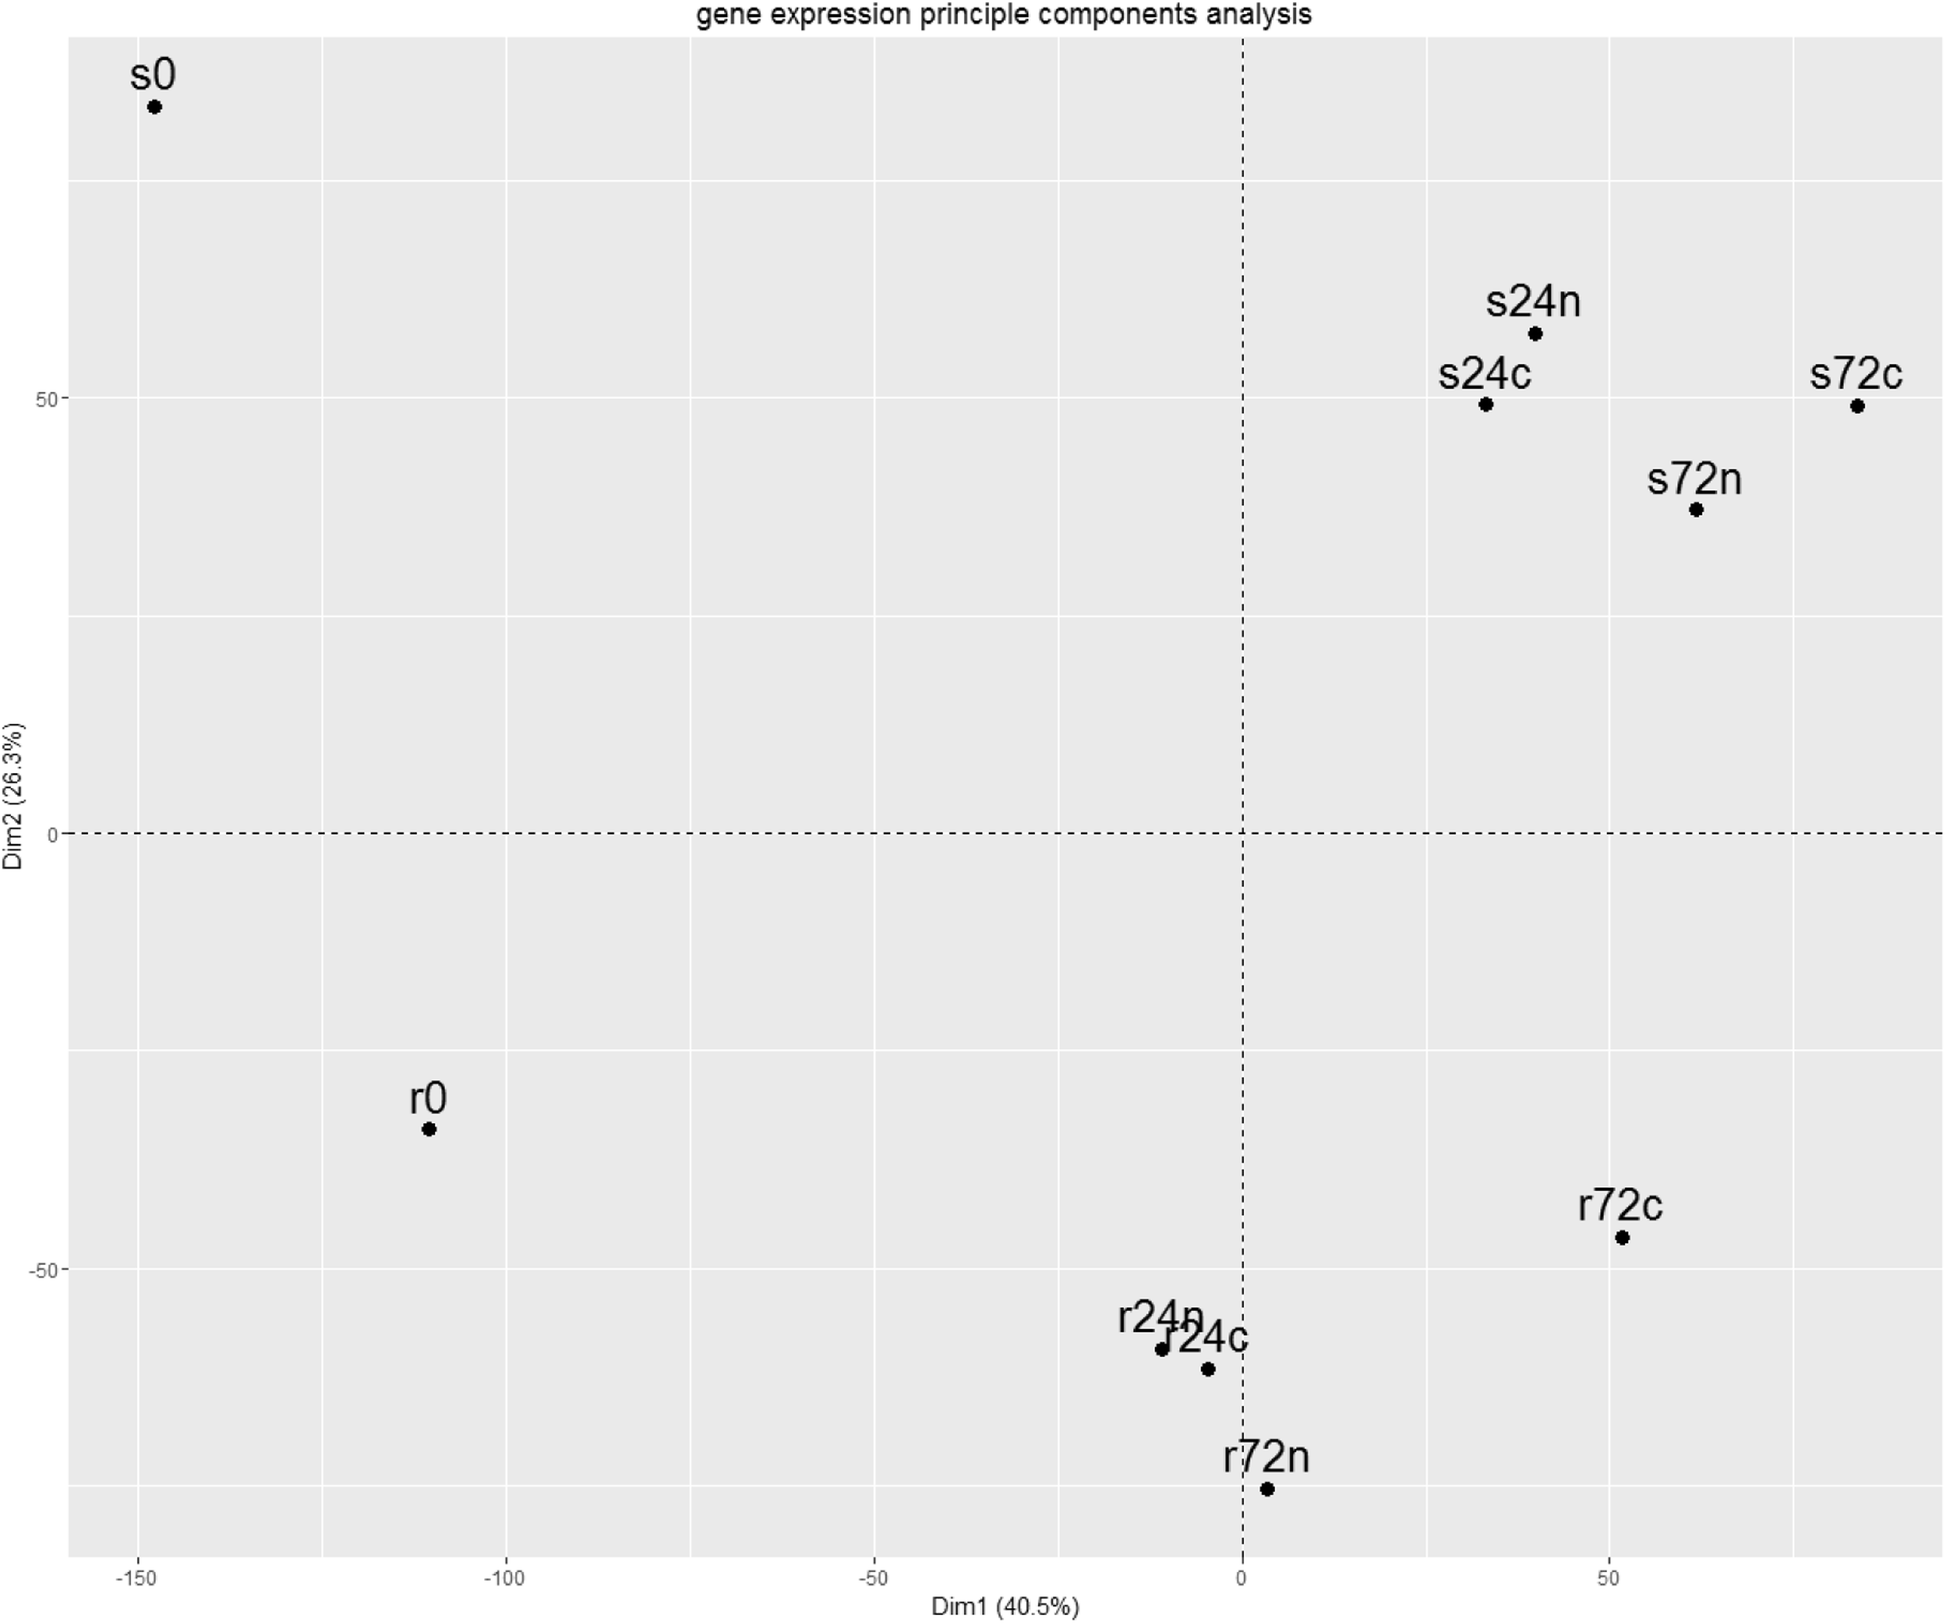
PCA plot of samples analyzed for two largest components. The first component, X axis (40.5% of total variance), the second component, Y axis (26.3% of total variance). Designations: r, S. phureja genotype resistant to GPCN; s, S. phureja genotype susceptible to GPCN; 24, 72 – hours after plant roots inoculation (hpi) with either water (c, control) or nematode (n); 0, samples of resistant and susceptible plants roots without any inoculation. For example, r24n, transcriptome of S. phureja resistant genotype taken at 24 hpi point