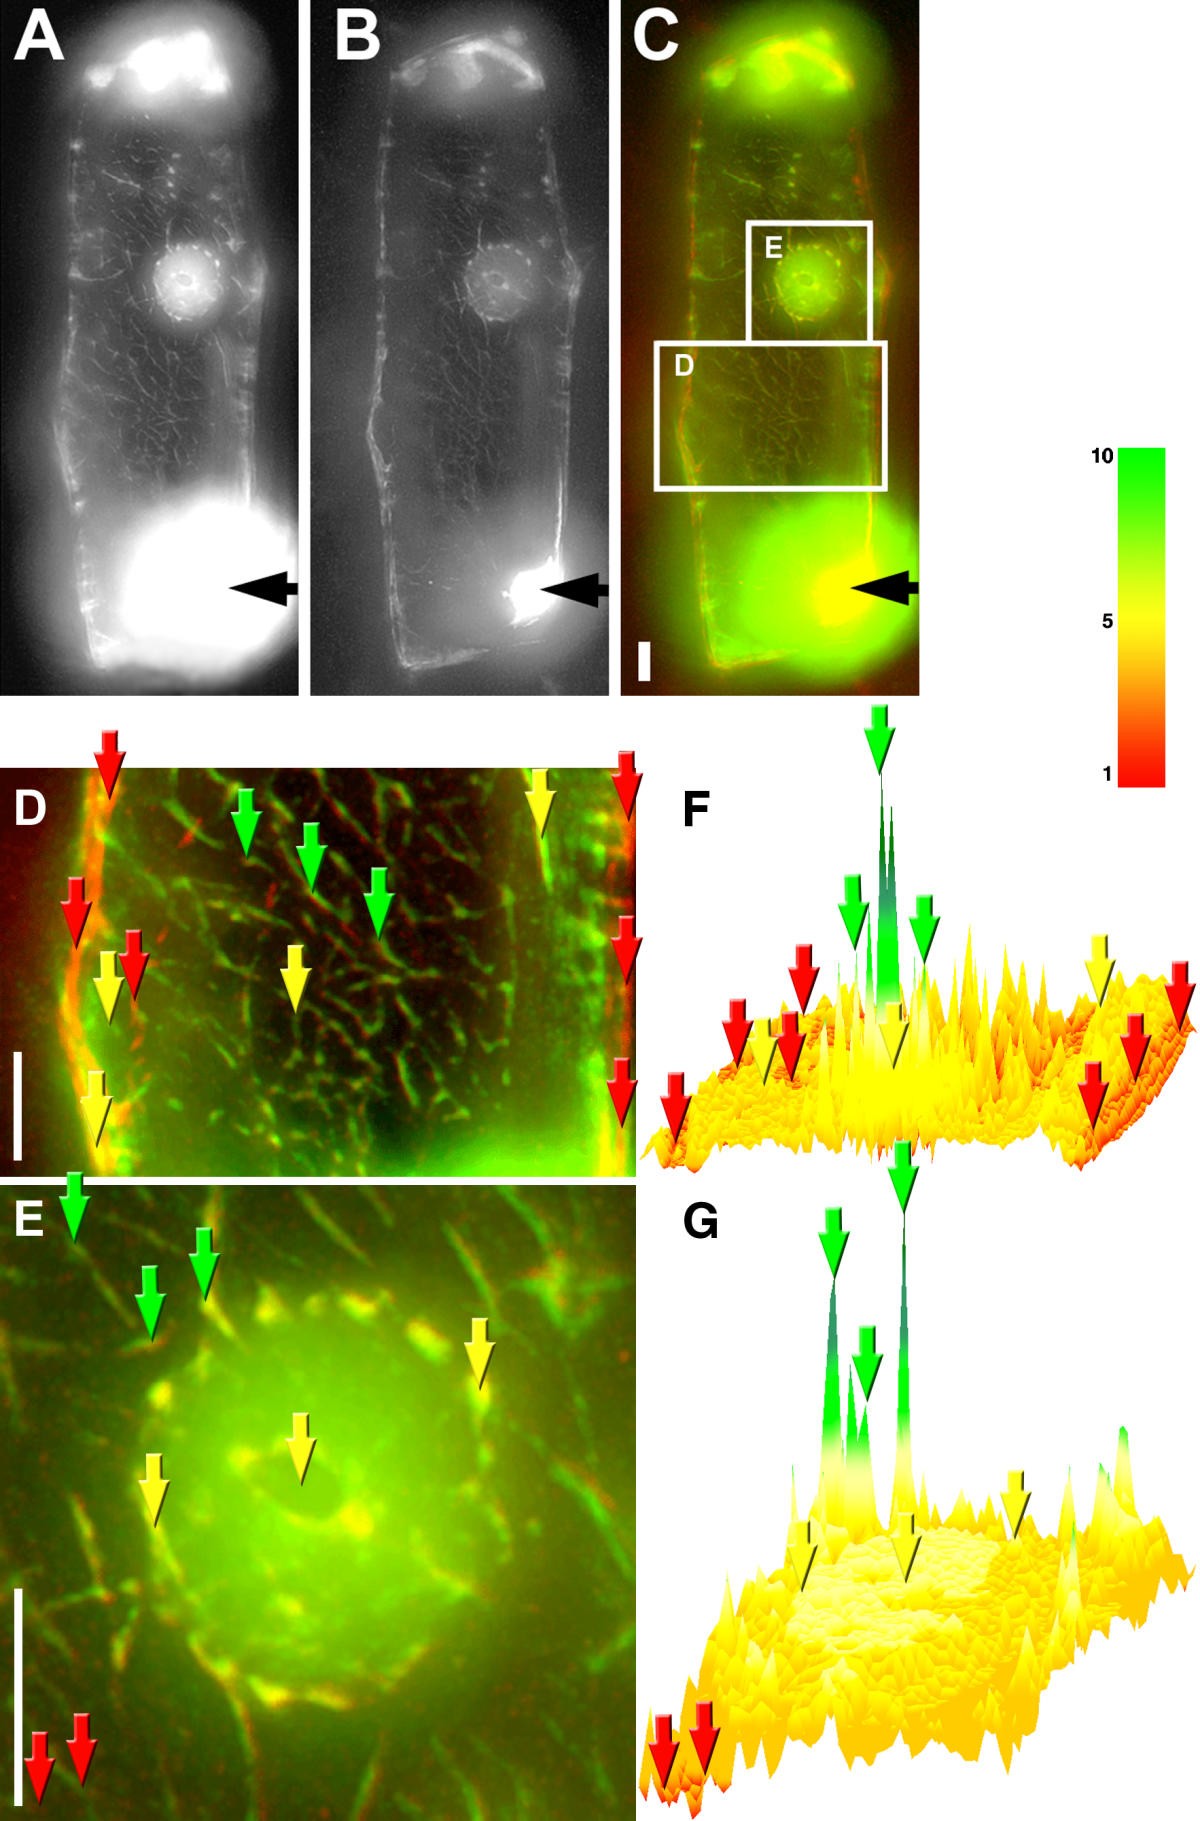
Figure 4
From: Incorporation of mammalian actin into microfilaments in plant cell nucleus

Ratio imaging of microinjected actin-Alexa Fluor® 488 label and rhodamine-phalloidin staining. Microinjected actin-Alexa Fluor® 488 label and phalloidin staining in an onion bulb scale epidermis cell 1 h after injection of actin-Alexa Fluor® 488 conjugate, single optical slice through the central region of nuclei after deconvolution of the images, A, Alexa Fluor® 488 label. B, Rhodamine-phalloidin staining. C, overlay of A (green) and B (red). D, Cytoplasm. E, Nucleus. F and G, ratio images of green/red signals from D and E, respectively. Black arrows, the injection site. Examples of points in the cell with high green/red ratio, green arrows; low green/red ratio, red arrows; medium green/red ratio, yellow arrows. Bars, 10 μm, color bar for F and G, relative value of green/red signals.