Table 1 Kinetics of digestion1 of the resistant starch assay for Wt and sbe1a mutant starch2
Starch | y 0 (%) | S 1 (%) | k 1 (min-1) | S2(%) | k2(min-1) |
|---|---|---|---|---|---|
Wt | -5.4 ± 2.3a | 85.9 ± 3.5b | 1.4 ± 0.1a (×10-2) | 17.9 ± 5.4a | 0.9 ± 0.2a (×10-3) |
sbe1a | 13.7 ± 2.8b | 59.8 ± 3.0a | 1.8 ± 0.1b (×10-2) | 24.3 ± 2.4a | 3.0 ± 1.1b (×10-3) |
- 1 Kinetic parameters are obtained from model fit using the double exponential decay equation:
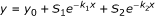 where y is % NDS, x is the time, y
0
is the y-value that the model asymptotically approaches, S
1
and S
2
are the concentrations of the two different substrate components, and k
1
and k
2
are the reaction rate constants for the decay of the two different components.
where y is % NDS, x is the time, y
0
is the y-value that the model asymptotically approaches, S
1
and S
2
are the concentrations of the two different substrate components, and k
1
and k
2
are the reaction rate constants for the decay of the two different components. - 2 Values are expressed as mean ± SD for three biological replications. Values for each biological replication were obtained from fit of combined data from two independent digestions. Significant differences (p < 0.05) in the same column, as determined by one-way ANOVA analysis, are indicated by different superscripts.
 where y is % NDS, x is the time, y
0
is the y-value that the model asymptotically approaches, S
1
and S
2
are the concentrations of the two different substrate components, and k
1
and k
2
are the reaction rate constants for the decay of the two different components.
where y is % NDS, x is the time, y
0
is the y-value that the model asymptotically approaches, S
1
and S
2
are the concentrations of the two different substrate components, and k
1
and k
2
are the reaction rate constants for the decay of the two different components.